(Mark One) | ||
ANNUAL REPORT PURSUANT TO SECTION 13 OR 15(d) OF THE SECURITIES EXCHANGE ACT OF 1934 |
TRANSITION REPORT PURSUANT TO SECTION 13 OR 15(d) OF THE SECURITIES EXCHANGE ACT OF 1934 |
(Exact Name of Registrant as Specified in its Charter) |
(State or Other Jurisdiction of Incorporation) | (I.R.S. Employer Identification No.) |
Title of each class | Trading Symbol | Name of each exchange on which registered | ||
Page | ||
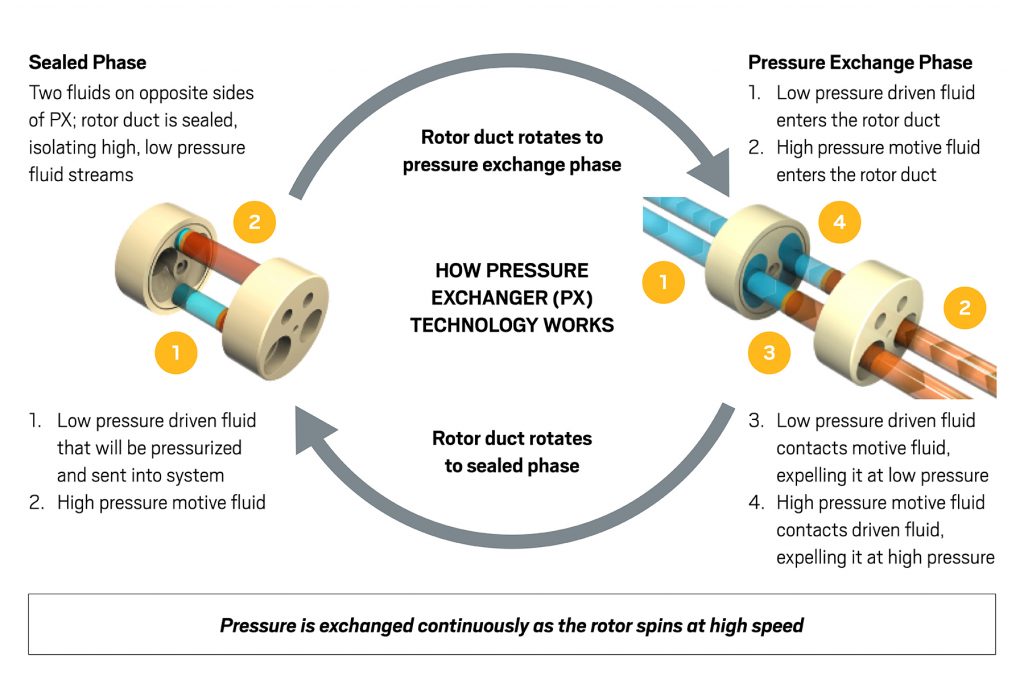
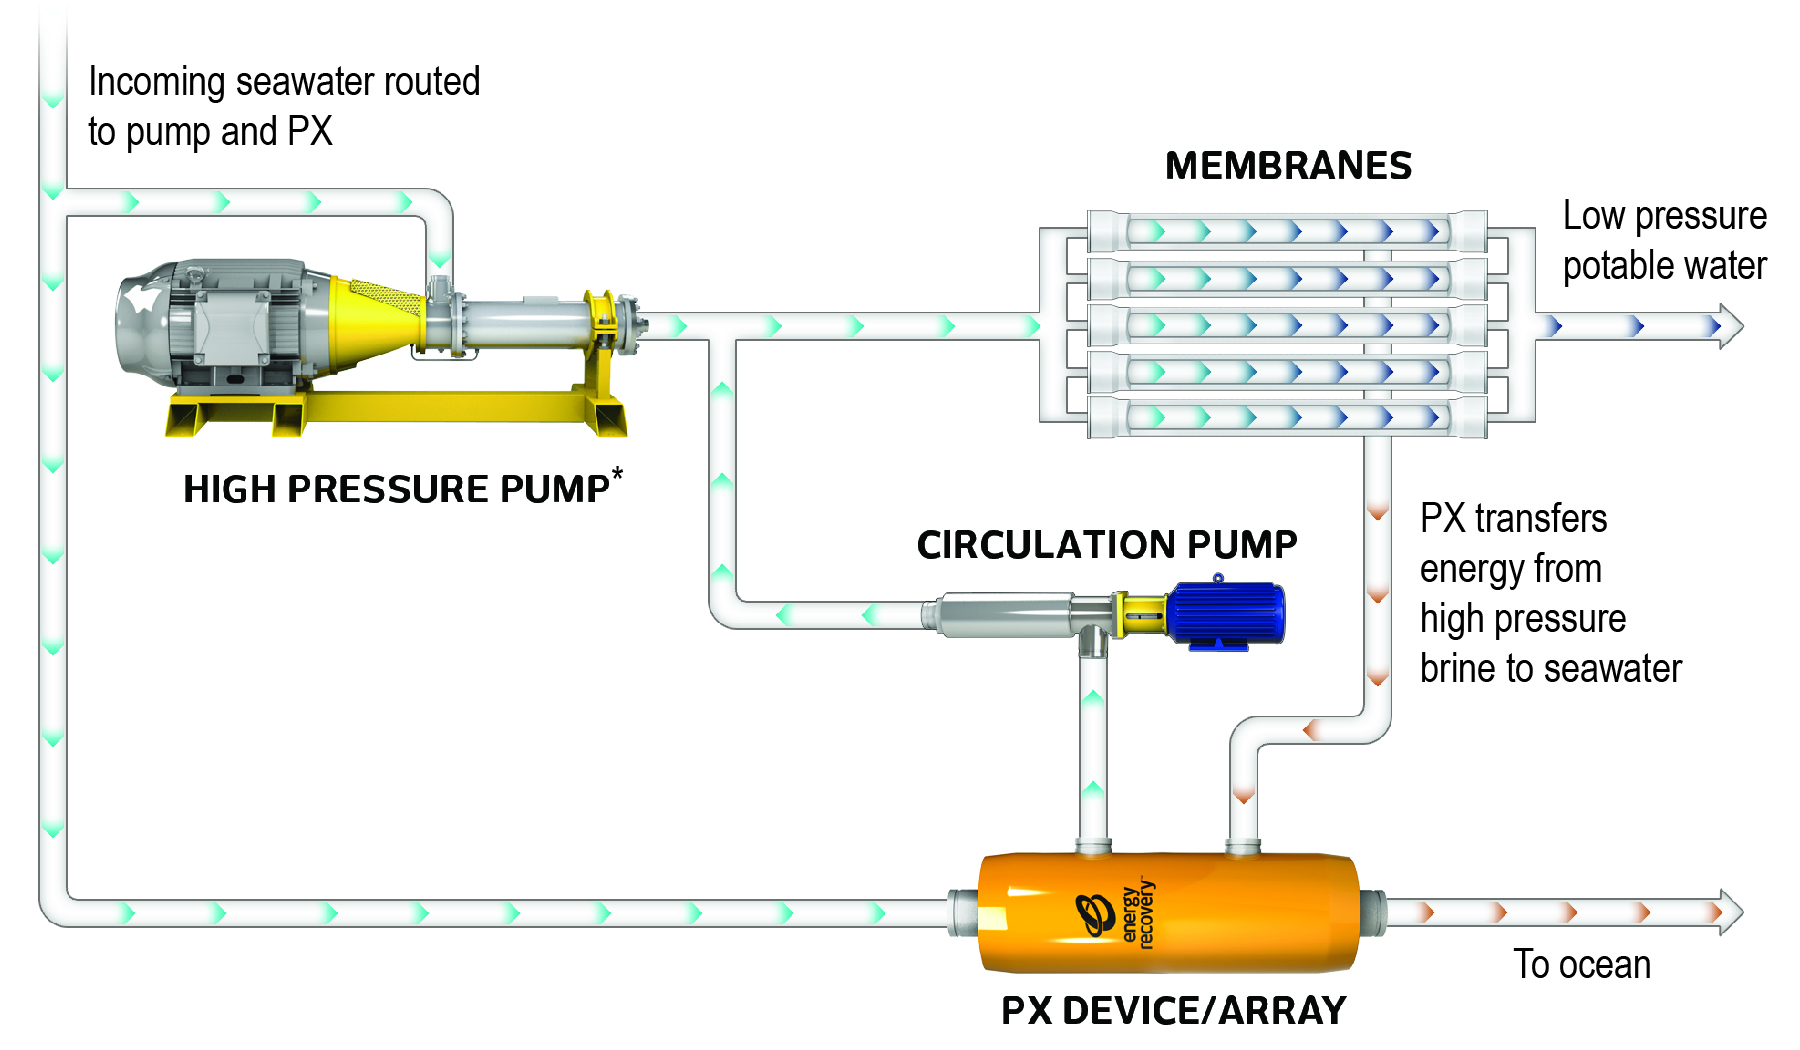
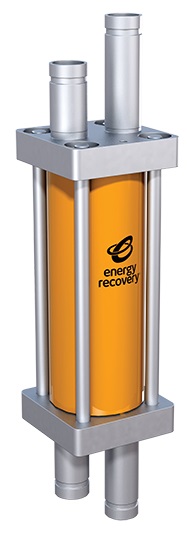
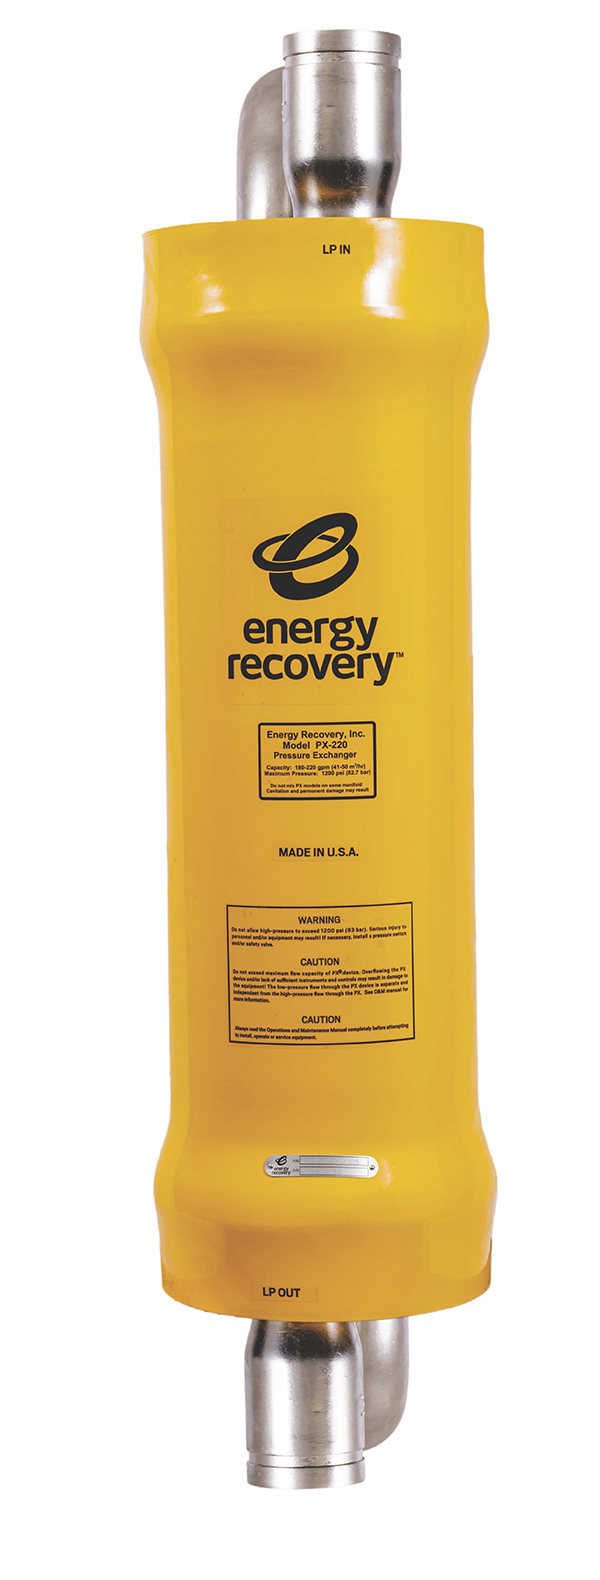
•our belief that the pressure exchanger is the industry standard for energy recovery in the seawater reverse osmosis desalination (“SWRO”) industry; |
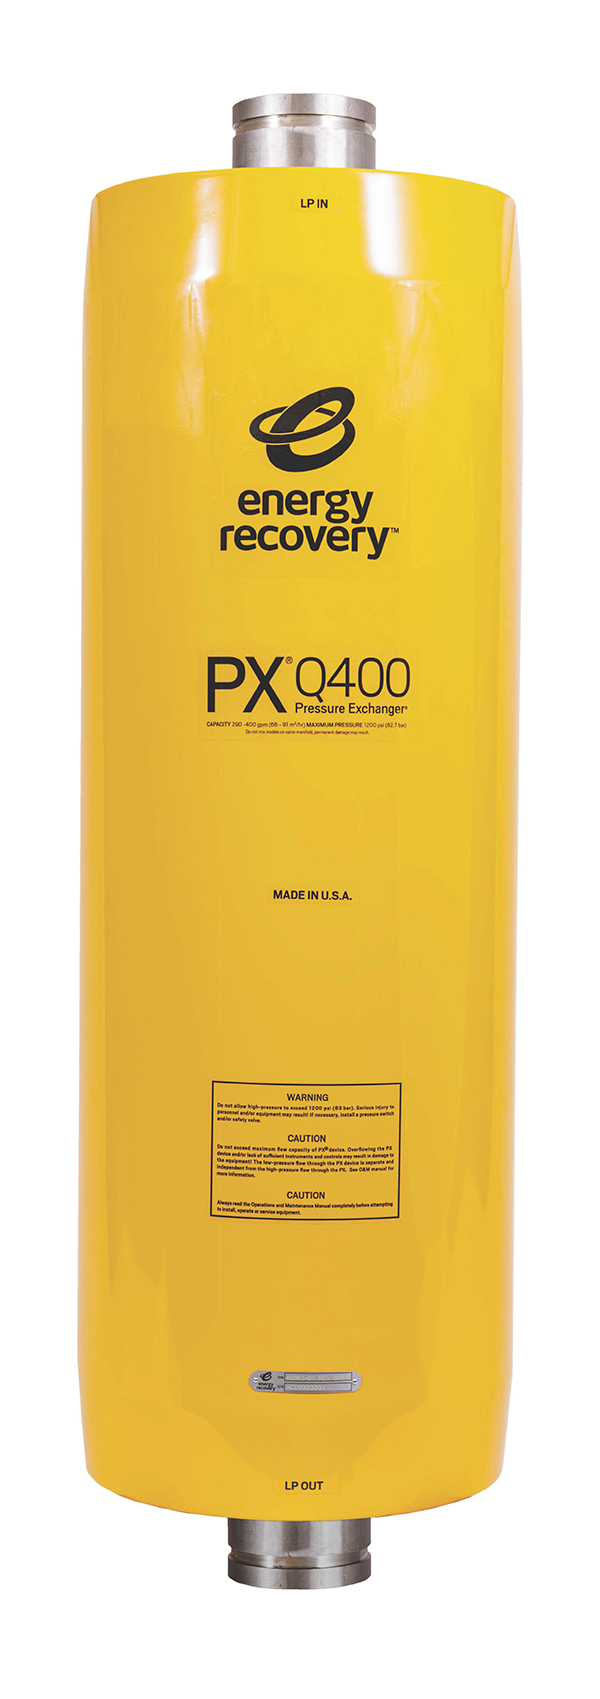
•our belief that the scalability and versatility of our PX® Pressure Exchanger® (“PX”) can help us achieve success in emerging wastewater markets; |
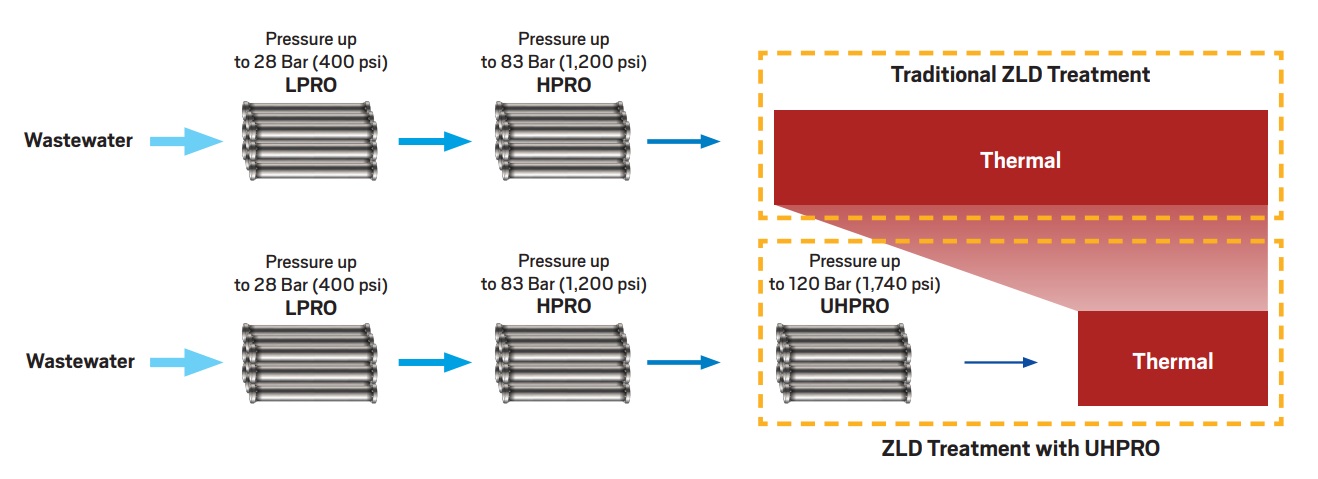
•our belief that the Ultra PX™ addresses key challenges associated with treating wastewater in a range of reverse osmosis (“RO”) applications; |
•our belief that the Ultra PX addresses key challenges, such as energy intensity and environmental impacts associated with treating wastewater; |
•our belief that the Ultra PX can help make RO the preferred treatment option to achieve zero and minimum liquid discharge (“ZLD” and “MLD”, respectively) requirements by enhancing RO’s affordability and efficiency compared to thermal treatment options; |
•our belief that our PX has helped make SWRO an economically viable and more sustainable option in the production of potable water; |
•our expectation of greater demand of our PX in the wastewater market due to expanding environmental regulations; |
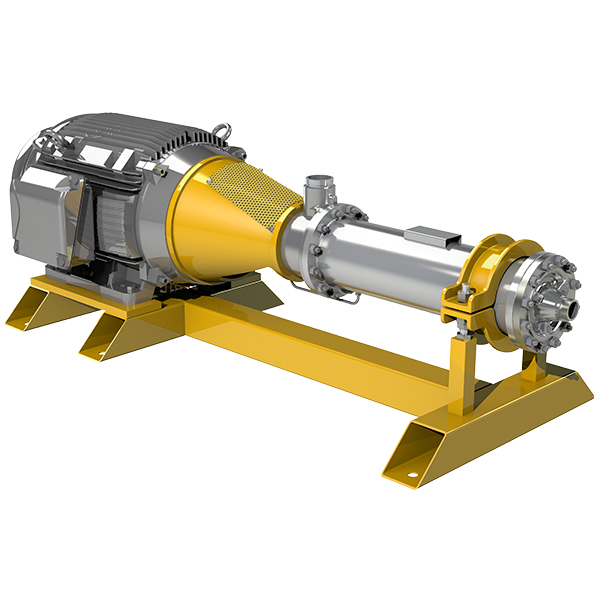
•our belief that our hydraulic turbochargers deliver substantial savings, operational benefits and ease of integration into desalination systems; |
•our anticipation that markets not traditionally associated with desalination, such as the United States of America (the “U.S.”) and China will inevitably develop and provide further revenue growth opportunities; |
•our belief that countries around the world will continue to mandate ZLD or MLD requirements for specific industries; |
•our belief that, as the existing thermal technology is replaced with RO technology, demand for our products will be created; |
•our belief that our PX offers market-leading value with the highest technological and economic benefit; |
•our belief that ongoing operating costs and life cycle costs rather than the initial capital expenditures are the key factor in the selection of an energy recovery device solution for megaproject (“MPD”) customers; |
•our belief that initial capital expenditure rather than future ongoing operating costs is more of a factor in the selection of an energy recovery device solution for original equipment manufacturer (“OEM”) projects; |
•our belief that our PX has a distinct competitive advantage in the market for desalination plants and numerous wastewater market verticals, because our PX 1) has minimal unplanned and planned downtime, resulting in lower lifecycle maintenance cost, 2) is a cost-effective energy recovery solution, 3) is made with highly durable and corrosion-resistant aluminum oxide (“alumina”) ceramic parts and outperforms our competition with respect to quality, flexibility and durability, and 4) is warrantied for high efficiencies; |
•our belief that leveraging our pressure exchanger technology will unlock new commercial opportunities in the future; |
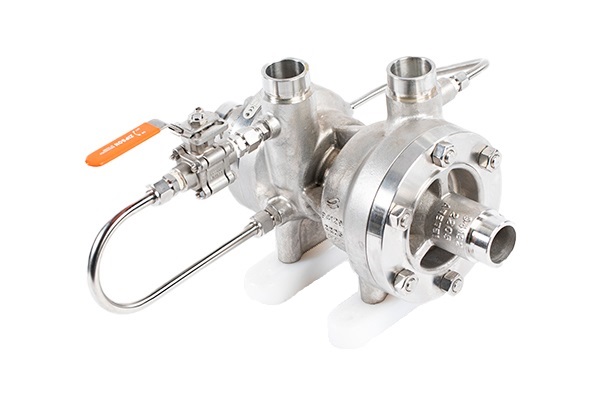
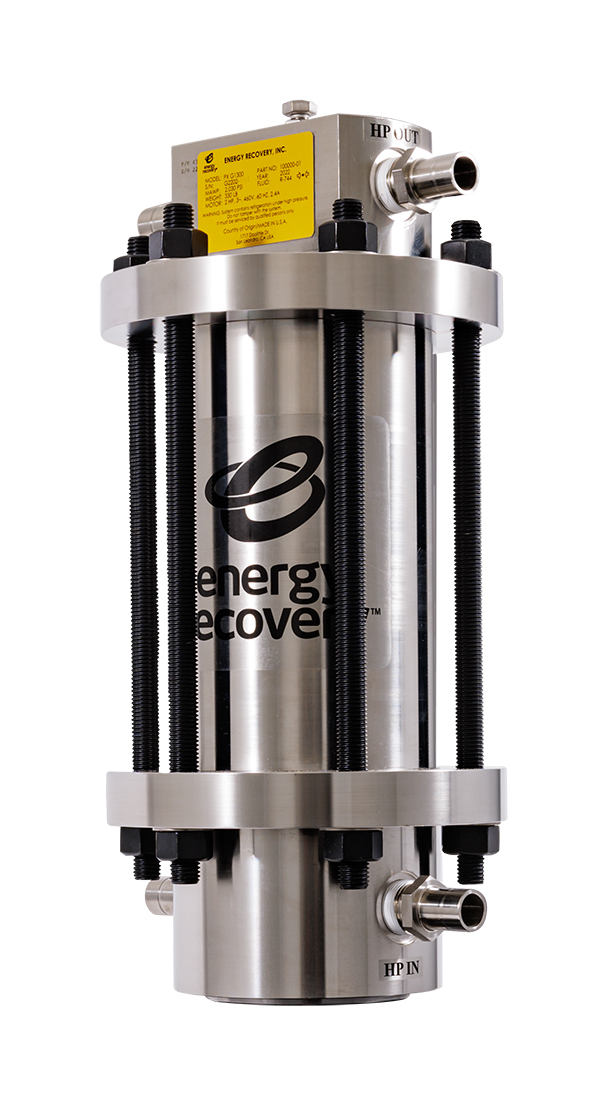
•our belief that our PX G1300™ can contribute to help make CO2-based refrigeration economically viable in a broader range of climates; |
•our belief that the PX G1300 could eventually alter the standard refrigeration system architecture by reducing costs for retail end users such as grocery stores; |
•our belief that there is a significant potential market for the PX G1300 in a variety of channels, such as supermarket chains and cold storage facilities. |
•our expectation that we will initially sell our PX G1300 to a variety of customers, such as to the OEMs themselves, potentially directly to end user supermarket chains or industrial sites, or to contractors who may retrofit our technology onto existing systems, and once the PX G1300 is established, our belief that our sales process will evolve to primarily selling through OEMs; |
•our belief that as CO2-based refrigeration systems become more prevalent, competitive technologies to the PX G1300 could arise; |
•our belief that the simplicity of installation and the ease of operations of the PX G1300 could encourage adoption of the PX G1300; |
•our belief that our current facilities will be adequate for the foreseeable future; |
•our belief that by investing in research and development, we will be well positioned to continue to execute on our product strategy; |
•our belief that our technology helps our customer achieve environmentally sustainable operations; |
•our expectation that sales outside of the U.S. will remain a significant portion of our revenue; |
•our belief that the integration of sustainability principles into our corporate and risk management strategies can strengthen our existing business as well as our efforts to develop new applications of pressure exchanger technology for high-pressure fluid- flow environments; |
•our belief that our sustainability goals are highly influential to our business success; |
•our belief that we contribute to our customers’ operational profitability while advancing environmental sustainability; |
•the timing of our receipt of payment for products or services from our customers; |
•our belief that our existing cash and cash equivalents, our short and/or long-term investments, and the ongoing cash generated from our operations, will be sufficient to meet our anticipated liquidity needs for the foreseeable future, with the exception of a decision to enter into an acquisition and/or fund investments in our latest technology arising from rapid market adoption that could require us to seek additional equity or debt financing; |
•our belief that our cash deposit risk at uninsured or under insured financial institutions will not materially affect our current liquidity; |
•our expectation that the lender under our current credit agreement, as amended, will continue to honor its commitments to us; |
•our expectation that, as we expand our international sales, a portion of our revenue could be denominated in foreign currencies and the impact of changes in exchange rates on our cash and operating results; |
•our expectation of increased sales and marketing expenditures for 2024 and 2025; |
•our belief that we will be in compliance with the terms of the existing credit agreement, as amended, in the future; |
•our expectation that we will continue to receive a tax benefit related to U.S. federal foreign-derived intangible income and California research and development tax credit; |
•our expectation that we will be able to enforce our intellectual property (“IP”) rights; |
•our expectation that the adoption of new accounting standards will not have a material impact on our financial position or results of operations; |
•the outcome of proceedings, lawsuits, disputes and claims; |
•the impact of losses due to indemnification obligations; |
•the impact of changes in internal control over financial reporting; and |
•other factors disclosed under Part I, Item 1, “Business,” Item 1A, “Risk Factors,” and Item 2, “Properties,” and Part II, Item 7, MD&A, and Item 7A, “Quantitative and Qualitative Disclosures about Market Risk,” and elsewhere in this Form 10‑K. |
Facility | Location | Status | Approximate Square Footage | Lease Expiration | ||||
Headquarters, R&D and manufacturing | San Leandro, California | Lease | 171,000 | Dec- 2028 | ||||
Manufacturing and warehouse | Tracy, California | Lease | 54,429 | Apr- 2030 | ||||
Office, R&D, warehouse, and yard | Katy, Texas | Lease | 221,220 | Jun- 2029 |
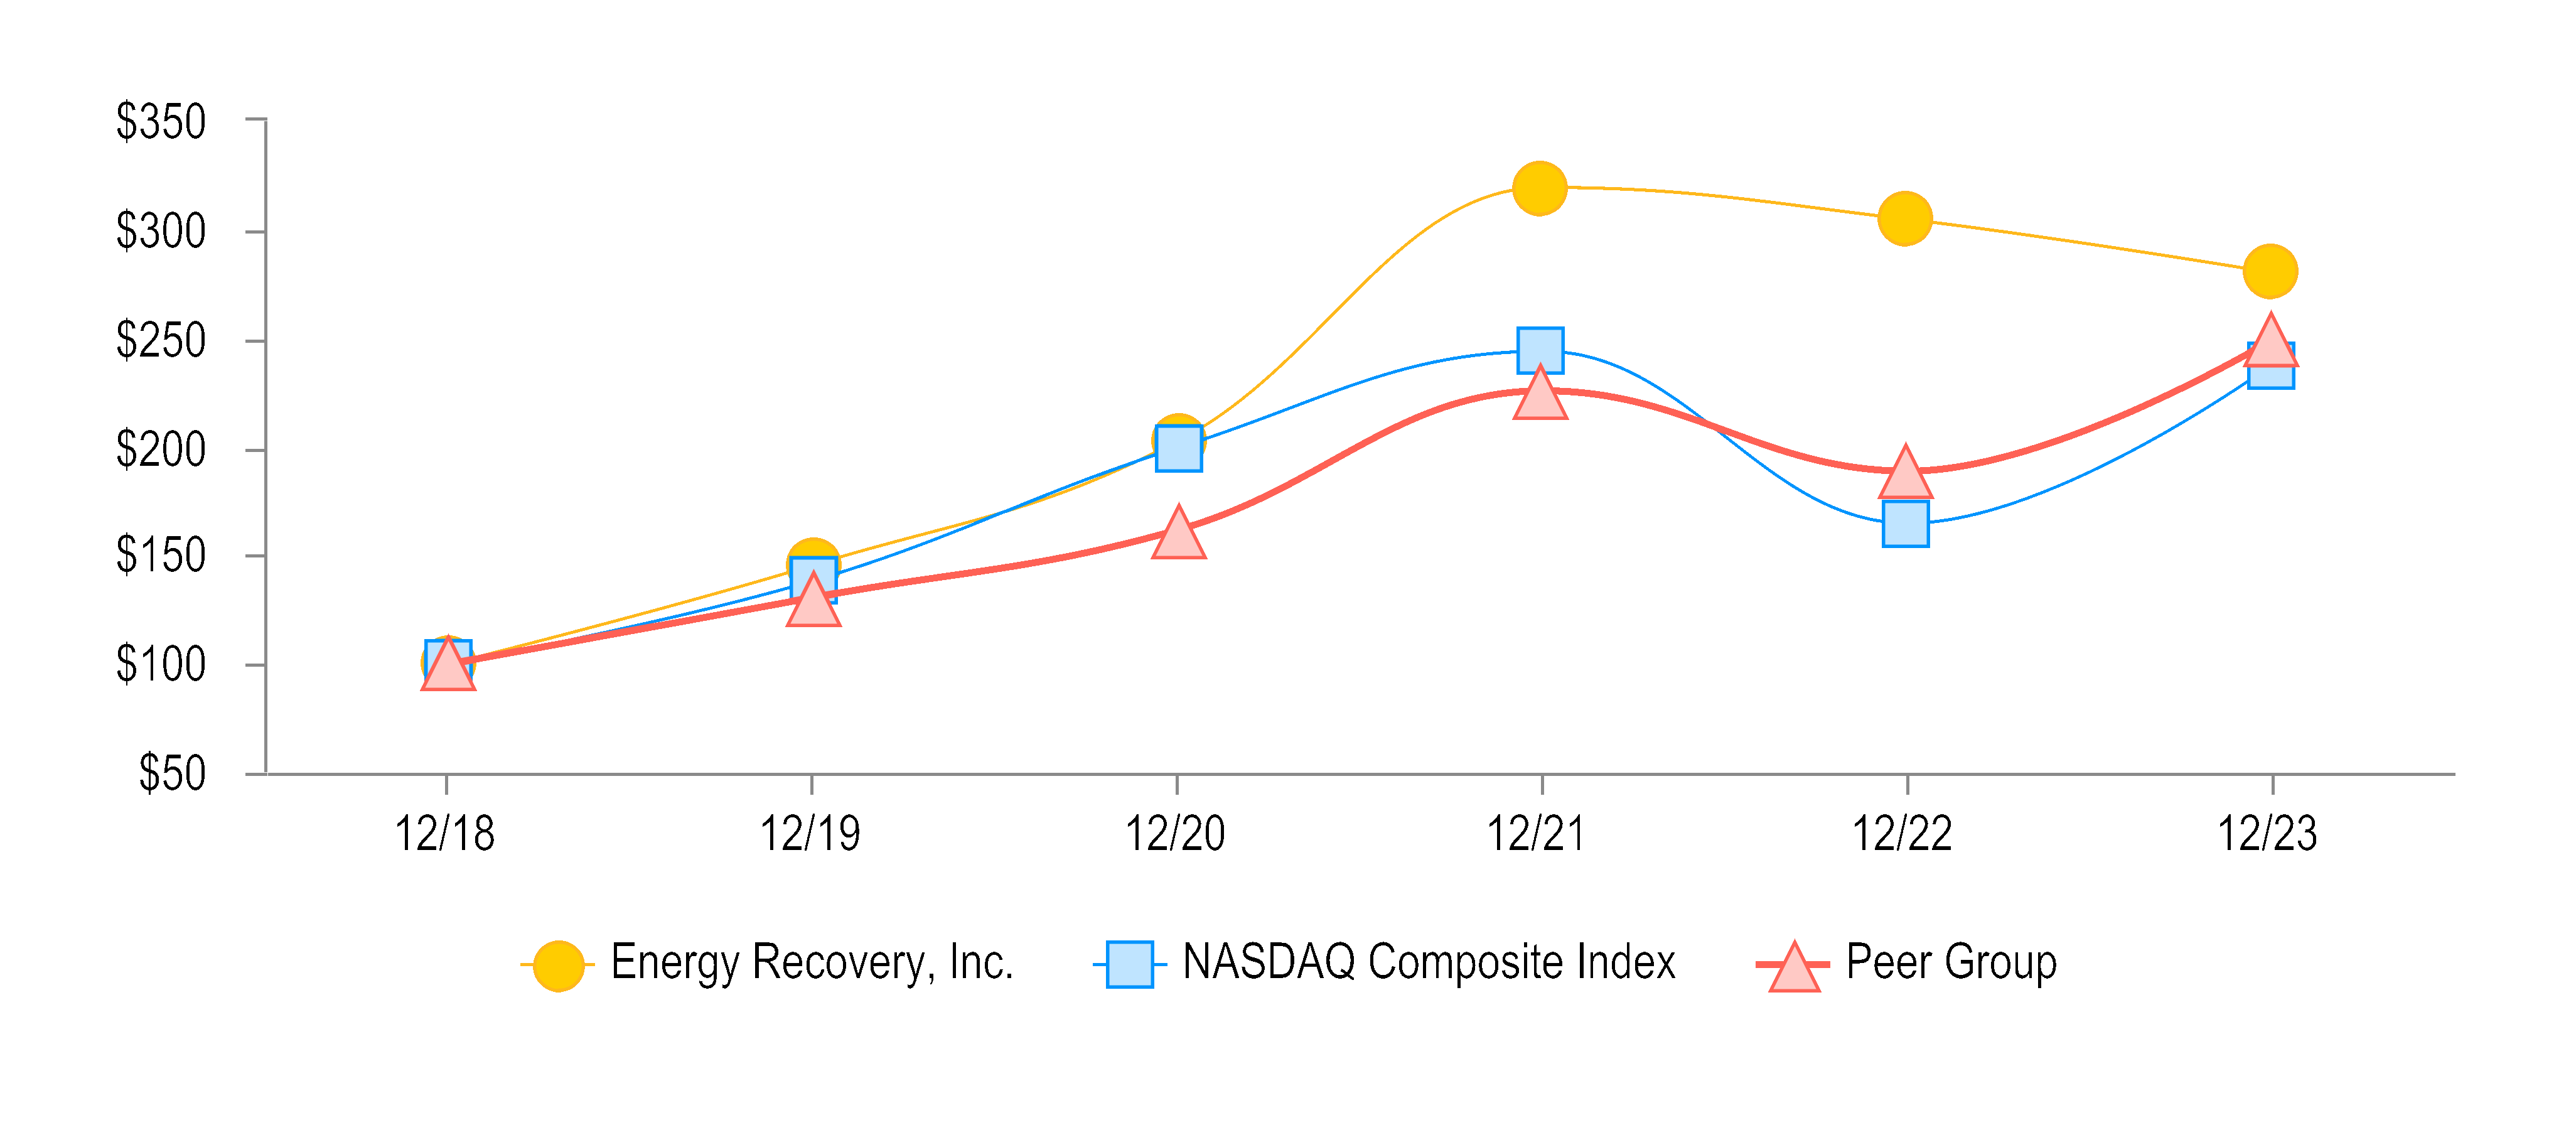
As of December 31, | |||||||||||
2018 | 2019 | 2020 | 2021 | 2022 | 2023 | ||||||
Energy Recovery, Inc. | $100.00 | $145.47 | $202.67 | $319.32 | $304.46 | $279.94 | |||||
NASDAQ Composite Index | 100.00 | 138.27 | 199.64 | 243.92 | 164.56 | 238.01 | |||||
Peer Group | 100.00 | 130.56 | 161.69 | 225.56 | 188.67 | 249.19 |
Years Ended December 31, | |||||||||||
2023 | 2022 | ||||||||||
$ | % of Revenue | $ | % of Revenue | Change | |||||||
(In thousands, except percentages) | |||||||||||
Megaproject | $83,665 | 65% | $81,888 | 65% | $1,777 | 2% | |||||
Original equipment manufacturer | 25,995 | 20% | 28,858 | 23% | (2,863) | (10%) | |||||
Aftermarket | 18,689 | 15% | 14,845 | 12% | 3,844 | 26% | |||||
Total revenue | $128,349 | 100% | $125,591 | 100% | $2,758 | 2% |
Years Ended December 31, | |||||||||||
2023 | 2022 | ||||||||||
Water | Emerging Technologies | Total | Water | Emerging Technologies | Total | ||||||
Middle East and Africa | $76,437 | $177 | $76,614 | $86,227 | $94 | $86,321 | |||||
Asia | 30,500 | — | 30,500 | 24,777 | — | 24,777 | |||||
Americas | 15,048 | 153 | 15,201 | 8,544 | 34 | 8,578 | |||||
Europe | 5,740 | 294 | 6,034 | 5,880 | 35 | 5,915 | |||||
Total revenue | $127,725 | $624 | $128,349 | $125,428 | $163 | $125,591 |
Years Ended December 31, | |||
2023 | 2022 | ||
United States | 2% | 1% | |
International | 98% | 99% | |
Total revenue | 100% | 100% |
Years Ended December 31, | |||||
Segment | 2023 | 2022 | |||
Customer B | Water | ** | 18% | ||
Customer D | Water | ** | 15% | ||
Customer E | Water | 13% | ** | ||
Customer F | Water | ** | 11% |
Years Ended December 31, | |||||||||||
2023 | 2022 | ||||||||||
$ | Gross Margin % | $ | Gross Margin % | Change in Product Gross Profit | |||||||
(In thousands, except percentages) | |||||||||||
Gross profit and gross margin | $87,079 | 67.8% | $87,356 | 69.6% | $(277) | (0.3%) |
Year Ended December 31, 2023 | Year Ended December 31, 2022 | ||||||||||||||
Water | Emerging Technologies | Corporate | Total | Water | Emerging Technologies | Corporate | Total | ||||||||
(In thousands) | |||||||||||||||
General and administrative | $7,751 | $3,927 | $17,186 | $28,864 | $6,936 | $4,104 | $17,301 | $28,341 | |||||||
Sales and marketing | 13,691 | 6,053 | 2,420 | 22,164 | 11,065 | 3,047 | 2,165 | 16,277 | |||||||
Research and development | 4,251 | 12,750 | — | 17,001 | 4,151 | 13,758 | — | 17,909 | |||||||
Total operating expenses | $25,693 | $22,730 | $19,606 | $68,029 | $22,152 | $20,909 | $19,466 | $62,527 |
Years Ended December 31, | |||
2023 | 2022 | ||
(In thousands) | |||
Interest income | $3,756 | $908 | |
Other non-operating (expense) income, net | (101) | 334 | |
Total other income, net | $3,655 | $1,242 |
Years Ended December 31, | |||||
2023 | 2022 | Change | |||
(In thousands, except percentages) | |||||
Provision for income taxes | $1,201 | $2,022 | $(821) | ||
Effective tax rate | 5% | 8% |
Years Ended December 31, | |||||
2023 | 2022 | Change | |||
(In thousands) | |||||
Net cash provided by operating activities | $26,054 | $12,631 | $13,423 | ||
Net cash used in investing activities | (19,114) | (6,946) | (12,168) | ||
Net cash provided by (used in) financing activities | 4,794 | (23,668) | 28,462 | ||
Effect of exchange rate differences on cash and cash equivalents | 33 | (20) | 53 | ||
Net change in cash, cash equivalents and restricted cash | $11,767 | $(18,003) | $29,770 |
Page No. | |
Consolidated Financial Statements: | |
Consolidated Balance Sheets — December 31, 2023 and 2022 | |
Consolidated Statements of Operations — Years ended December 31, 2023, 2022 and 2021 | |
Consolidated Statements of Cash Flows — Years ended December 31, 2023, 2022 and 2021 | |
December 31, | |||
2023 | 2022 | ||
(In thousands, except shares and per share data) | |||
ASSETS | |||
Current assets: | |||
Cash and cash equivalents | $ | $ | |
Short-term investments | |||
Accounts receivable, net | |||
Inventories, net | |||
Prepaid expenses and other assets | |||
Total current assets | |||
Long-term investments | |||
Deferred tax assets, net | |||
Property and equipment, net | |||
Operating lease, right of use asset | |||
Goodwill | |||
Other assets, non-current | |||
Total assets | $ | $ | |
LIABILITIES AND STOCKHOLDERS’ EQUITY | |||
Current liabilities: | |||
Accounts payable | $ | $ | |
Accrued expenses and other liabilities | |||
Lease liabilities | |||
Contract liabilities | |||
Total current liabilities | |||
Lease liabilities, non-current | |||
Other liabilities, non-current | |||
Total liabilities | |||
Commitments and contingencies (Note 7) | |||
Stockholders’ equity: | |||
Preferred stock, $ December 31, 2023 and 2022 | |||
Common stock, $ outstanding at December 31, 2022 | |||
Additional paid-in capital | |||
Accumulated other comprehensive loss | ( | ( | |
Treasury stock, at cost, | ( | ( | |
Retained earnings | |||
Total stockholders’ equity | |||
Total liabilities and stockholders’ equity | $ | $ |
Years Ended December 31, | |||||
2023 | 2022 | 2021 | |||
(In thousands, except per share data) | |||||
Revenue | $ | $ | $ | ||
Cost of revenue | |||||
Gross profit | |||||
Operating expenses: | |||||
General and administrative | |||||
Sales and marketing | |||||
Research and development | |||||
Total operating expenses | |||||
Income from operations | |||||
Other income (expense): | |||||
Interest income | |||||
Other non-operating income (expense), net | ( | ( | |||
Total other income, net | |||||
Income before income taxes | |||||
Provision for (benefit from) income taxes | ( | ||||
Net income | $ | $ | $ | ||
Net income per share: | |||||
Basic | $ | $ | $ | ||
Diluted | $ | $ | $ | ||
Number of shares used in per share calculations: | |||||
Basic | |||||
Diluted |
Year Ended December 31, | |||||
2023 | 2022 | 2021 | |||
(In thousands) | |||||
Net income | $ | $ | $ | ||
Other comprehensive income (loss), net of tax | |||||
Foreign currency translation adjustments | ( | ||||
Unrealized gain (loss) on investments | ( | ( | |||
Total other comprehensive income (loss), net of tax | ( | ( | |||
Comprehensive income | $ | $ | $ |
Years Ended December 31, | |||||
2023 | 2022 | 2021 | |||
(In thousands, except shares) | |||||
Common stock | |||||
Beginning balance | $ | $ | $ | ||
Issuance of common stock, net | — | ||||
Ending balance | |||||
Additional paid-in capital | |||||
Beginning balance | |||||
Issuance of common stock, net | |||||
Stock-based compensation | |||||
Ending balance | |||||
Accumulated other comprehensive loss | |||||
Beginning balance | ( | ( | |||
Other comprehensive income (loss) | |||||
Foreign currency translation adjustments | ( | ||||
Unrealized gain (loss) on investments | ( | ( | |||
Total other comprehensive income (loss), net | ( | ( | |||
Ending balance | ( | ( | ( | ||
Treasury stock | |||||
Beginning balance | ( | ( | ( | ||
Common stock repurchased | — | ( | ( | ||
Ending balance | ( | ( | ( | ||
Retained earnings | |||||
Beginning balance | |||||
Net income | |||||
Ending balance | |||||
Total stockholders’ equity | $ | $ | $ | ||
Common stock issued (shares) | |||||
Beginning balance | |||||
Issuance of common stock, net | |||||
Ending balance | |||||
Treasury stock (shares) | |||||
Beginning balance | |||||
Common stock repurchased | — | ||||
Ending balance | |||||
Total common stock outstanding (shares) |
Years Ended December 31, | |||||
2023 | 2022 | 2021 | |||
(In thousands) | |||||
Cash flows from operating activities: | |||||
Net income | $ | $ | $ | ||
Adjustments to reconcile net income to cash provided by operating activities | |||||
Stock-based compensation | |||||
Depreciation and amortization | |||||
Right of use asset amortization | |||||
(Accretion) amortization of premiums and discounts on investments | ( | ||||
Deferred income taxes | ( | ( | |||
Other non-cash adjustments | ( | ||||
Changes in operating assets and liabilities: | |||||
Accounts receivable, net | ( | ( | ( | ||
Contract assets | ( | ||||
Inventories, net | ( | ( | |||
Prepaid and other assets | ( | ||||
Accounts payable | ( | ||||
Accrued expenses and other liabilities | ( | ( | |||
Contract liabilities | ( | ( | |||
Net cash provided by operating activities | |||||
Cash flows from investing activities: | |||||
Sales of marketable securities | |||||
Maturities of marketable securities | |||||
Purchases of marketable securities | ( | ( | ( | ||
Capital expenditures | ( | ( | ( | ||
Proceeds from sales of fixed assets | |||||
Net cash used in investing activities | ( | ( | ( | ||
Cash flows from financing activities: | |||||
Net proceeds from issuance of common stock | |||||
Repurchase of common stock | ( | ( | |||
Net cash provided by (used in) financing activities | ( | ( | |||
Effect of exchange rate differences on cash and cash equivalents | ( | ( | |||
Net change in cash, cash equivalents and restricted cash | ( | ( | |||
Cash, cash equivalents and restricted cash, beginning of year | |||||
Cash, cash equivalents and restricted cash, end of year | $ | $ | $ | ||
Supplemental disclosure of cash flow information: | |||||
Cash received for income tax refunds | $ | $ | $ | ||
Cash paid for income taxes | |||||
Supplemental disclosure on non-cash investing and financing transactions: | |||||
Purchases of property and equipment in trade accounts payable, and accrued expenses and other liabilities | $ | $ | $ |
Minimum | Maximum | ||
Machinery and equipment (excluding equipment used for manufacturing of ceramic components)) | |||
Machinery and equipment used for manufacturing of ceramic components | |||
Leasehold improvements (1) | |||
Software (2) | |||
Office equipment, furniture, and fixtures | |||
Automobiles |
Years Ended December 31, | |||||||||||||||||
2023 | 2022 | 2021 | |||||||||||||||
Water | Emerging Technologies | Total | Water | Emerging Technologies | Total | Water | Emerging Technologies | Total | |||||||||
(In thousands) | |||||||||||||||||
Geographical market | |||||||||||||||||
Middle East and Africa | $ | $ | $ | $ | $ | $ | $ | $ | $ | ||||||||
Asia | |||||||||||||||||
Americas | |||||||||||||||||
Europe | |||||||||||||||||
Total revenue | $ | $ | $ | $ | $ | $ | $ | $ | $ | ||||||||
Channel | |||||||||||||||||
Megaproject | $ | $ | $ | $ | $ | $ | $ | $ | $ | ||||||||
Original equipment manufacturer | |||||||||||||||||
Aftermarket | |||||||||||||||||
Total revenue | $ | $ | $ | $ | $ | $ | $ | $ | $ |
December 31, | |||
2023 | 2022 | ||
(In thousands) | |||
Accounts receivable, net | $ | $ | |
Contract assets, current (included in prepaid expenses and other assets) | |||
Contract liabilities: | |||
Contract liabilities, current | $ | $ | |
Contract liabilities, non-current (included in other liabilities, non-current) | |||
Total contract liabilities | $ | $ |
Years Ended December 31, | |||||
2023 | 2022 | 2021 | |||
(In thousands) | |||||
Contract liabilities, beginning of year | $ | $ | $ | ||
Revenue recognized | ( | ( | ( | ||
Cash received, excluding amounts recognized as revenue during the period | |||||
Contract liabilities, end of year | $ | $ | $ |
Year | Future Performance Obligations | |
(In thousands) | ||
2025 |
Years Ended December 31, | |||||
2023 | 2022 | 2021 | |||
(In thousands, except per share amounts) | |||||
Numerator | |||||
Net income | $ | $ | $ | ||
Denominator (weighted average shares) | |||||
Basic common shares outstanding | |||||
Dilutive stock awards | |||||
Diluted common shares outstanding | |||||
Net income per share | |||||
Basic | $ | $ | $ | ||
Diluted | $ | $ | $ |
Years Ended December 31, | |||||
2023 | 2022 | 2021 | |||
(In thousands) | |||||
Anti-dilutive stock award shares | |||||
December 31, | |||||
2023 | 2022 | 2021 | |||
(In thousands) | |||||
Cash and cash equivalents | $ | $ | $ | ||
Restricted cash, non-current (included in other assets, non-current) | |||||
Total cash, cash equivalents and restricted cash | $ | $ | $ |
December 31, | |||
2023 | 2022 | ||
(In thousands) | |||
Accounts receivable, gross | $ | $ | |
Allowance for doubtful accounts | ( | ( | |
Accounts receivable, net | $ | $ |
Years Ended December 31, | |||||
2023 | 2022 | 2021 | |||
(In thousands) | |||||
Balance, beginning of year | $ | $ | $ | ||
Changes to reserves (1) | |||||
Collection of specific reserves and uncollectible accounts written off, net of recoveries | ( | ( | ( | ||
Balance, end of year | $ | $ | $ |
December 31, | |||
2023 | 2022 | ||
(In thousands) | |||
Raw materials | $ | $ | |
Work in process | |||
Finished goods | |||
Inventories, gross | |||
Valuation adjustments for excess and obsolete inventory | ( | ( | |
Inventories, net | $ | $ |
December 31, | |||
2023 | 2022 | ||
(In thousands) | |||
Contract assets | $ | $ | |
Cloud computing arrangement implementation costs | |||
Supplier advances | |||
Insurance | |||
Interest receivable | |||
Other prepaid expenses and other assets | |||
Total prepaid expenses and other assets | |||
Restricted cash, non-current | |||
Security deposits, non-current | |||
Total other assets, non-current | |||
Total prepaid and other assets, and other assets, non-current | $ | $ |
December 31, | |||
2023 | 2022 | ||
(In thousands) | |||
Machinery and equipment | $ | $ | |
Leasehold improvements | |||
Software | |||
Office equipment, furniture, and fixtures | |||
Automobiles | |||
Construction in progress | |||
Total property and equipment | |||
Less: Accumulated depreciation and amortization | ( | ( | |
Total property and equipment, net | $ | $ |
Years Ended December 31, | |||||
2023 | 2022 | 2021 | |||
(In thousands) | |||||
Depreciation and amortization expense | $ | $ | $ |
December 31, | |||
2023 | 2022 | ||
(In thousands) | |||
Current | |||
Payroll, incentives and commissions payable | $ | $ | |
Warranty reserve | |||
Income taxes payable | |||
Other accrued expenses and other liabilities | |||
Total accrued expenses and other liabilities | |||
Other liabilities, non-current | |||
Total accrued expenses, and current and non-current other liabilities | $ | $ |
December 31, 2023 | December 31, 2022 | ||||||||||||||||
Pricing Category | Amortized Cost | Gross Unrealized Gains | Gross Unrealized Losses | Fair Value | Amortized Cost | Gross Unrealized Gains | Gross Unrealized Losses | Fair Value | |||||||||
(In thousands) | |||||||||||||||||
Cash equivalents | |||||||||||||||||
Money market securities | Level 1 | $ | $ | $ | $ | $ | $ | $ | $ | ||||||||
Short-term investments | |||||||||||||||||
U.S. treasury securities | Level 2 | ( | |||||||||||||||
Corporate notes and bonds | Level 2 | ( | ( | ||||||||||||||
Municipal and agency notes and bonds | Level 2 | ( | |||||||||||||||
Total short-term investments | ( | ( | |||||||||||||||
Long-term investments | |||||||||||||||||
Corporate notes and bonds | Level 2 | ( | ( | ||||||||||||||
Municipal and agency notes and bonds | Level 2 | ( | |||||||||||||||
Total long-term investments | ( | ( | |||||||||||||||
Total short and long-term investments | ( | ( | |||||||||||||||
Total | $ | $ | $( | $ | $ | $ | $( | $ |
December 31, 2023 | December 31, 2022 | ||||||
Fair Value | Gross Unrealized Losses | Fair Value | Gross Unrealized Losses | ||||
(In thousands) | |||||||
U.S. treasury securities | $ | $( | $ | $ | |||
Corporate notes and bonds | ( | ( | |||||
Municipal and agency notes and bonds | ( | ||||||
Total available-for-sale investments with unrealized loss positions | $ | $( | $ | $( |
Years Ended December 31, | |||||
2023 | 2022 | 2021 | |||
(In thousands) | |||||
Corporate notes and bonds | $ | $ | $ |
December 31, | |||
2023 | 2022 | ||
(In thousands) | |||
Outstanding letters of credit | $ | $ |
December 31, | |||
2023 | 2022 | ||
(In thousands) | |||
Operating lease, right of use asset | $ | $ | |
Lease liabilities, current | $ | $ | |
Lease liabilities, non-current | |||
Total lease liability | $ | $ |
Location | Purpose | Square Footage | Expiration (1) | Option to Extend (2) | ||||
San Leandro, California | Headquarters, R&D and manufacturing | December-2028 | ||||||
Tracy, California | Manufacturing and warehouse | April-2030 | ||||||
Katy, Texas | Office, R&D, warehouse, and yard | June-2029 |
Years Ended December 31, | |||||
2023 | 2022 | 2021 | |||
(In thousands) | |||||
Operating lease expense | $ | $ | $ | ||
Cash payments |
Weighted average remaining lease term | |
Weighted average discount rate |
Year | Lease Liabilities | |
(In thousands) | ||
2024 | $ | |
2025 | ||
2026 | ||
2027 | ||
2028 | ||
2029 and thereafter | ||
Total future minimum lease payments | ||
Less imputed lease interest | ( | |
Total lease liabilities | $ |
Years Ended December 31, | |||||
2023 | 2022 | 2021 | |||
(In thousands) | |||||
Warranty reserve balance, beginning of year | $ | $ | $ | ||
Warranty costs charged to cost of revenue | |||||
Utilization charges against reserve | ( | ( | ( | ||
Release of accrual related to expired warranties | ( | ( | ( | ||
Warranty reserve balance, end of year | $ | $ | $ |
Years Ended December 31, | |||||
2023 | 2022 | 2021 | |||
(In thousands) | |||||
Income before income taxes: | |||||
U.S. | $ | $ | $ | ||
Foreign | |||||
Total income before income taxes | $ | $ | $ | ||
Current tax provision: | |||||
Federal | $ | $ | $ | ||
State | |||||
Foreign | |||||
Current tax provision | |||||
Deferred tax provision (benefit): | |||||
Federal | ( | ( | |||
State | |||||
Total deferred tax provision (benefit) | ( | ( | |||
Total provision for (benefit from) income taxes | $ | $ | $( |
Years Ended December 31, | |||||
2023 | 2022 | 2021 | |||
U.S. federal taxes at statutory rate | |||||
State income tax, net of federal benefit | |||||
Foreign rate differential | |||||
Stock-based compensation | ( | ( | ( | ||
Non-deductible expenses | |||||
Federal research credits | ( | ( | ( | ||
Foreign derived intangible income | ( | ( | |||
Effective tax rate | ( |
December 31, | |||
2023 | 2022 | ||
(In thousands) | |||
Deferred tax assets: | |||
Net operating loss carry forwards | $ | $ | |
Amortization of research and experimental expenditures | |||
Accruals and reserves | |||
Operating lease liabilities | |||
Research and development, and foreign tax credit carry forwards | |||
Acquired intangibles | |||
Other | |||
Total deferred tax assets | |||
Valuation allowance | ( | ( | |
Total deferred tax assets, net of valuation allowance | |||
Deferred tax liabilities: | |||
Depreciation on property and equipment | ( | ( | |
Right of use asset | ( | ( | |
Other | ( | ||
Goodwill | ( | ( | |
Total deferred tax liabilities | ( | ( | |
Net deferred tax asset | $ | $ |
Expiration Year | December 31, | ||||
2023 | 2022 | ||||
(In thousands) | |||||
California | 2031 |
Expiration Year | December 31, | ||||
2023 | 2022 | ||||
(In thousands) | |||||
Federal | 2040 | $ | $ | ||
California | No Expiration Date | ||||
Total credit carryforwards | $ | $ |
Years Ended December 31, | |||||
2023 | 2022 | 2021 | |||
(In thousands) | |||||
Gross unrecognized tax benefits, beginning of year | $ | $ | $ | ||
Additions of current and prior year tax positions | |||||
Reductions of prior year tax positions | ( | ||||
Gross unrecognized tax benefits, end of year | $ | $ | $ |
Year Ended December 31, 2023 | Year Ended December 31, 2022 | Year Ended December 31, 2021 | |||||||||||||||
Water | Emerging Technologies | Total | Water | Emerging Technologies | Total | Water | Emerging Technologies | Total | |||||||||
(In thousands) | |||||||||||||||||
Revenue | $ | $ | $ | $ | $ | $ | $ | $ | $ | ||||||||
Cost of revenue | |||||||||||||||||
Gross profit (loss) | ( | ||||||||||||||||
Operating expenses | |||||||||||||||||
General and administrative | |||||||||||||||||
Sales and marketing | |||||||||||||||||
Research and development | |||||||||||||||||
Total operating expenses | |||||||||||||||||
Operating income (loss) | $ | $( | $ | $( | $ | $( | |||||||||||
Less: Corporate operating expenses | |||||||||||||||||
Income from operations | $ | $ | $ |
Years Ended December 31, | |||||
2023 | 2022 | 2021 | |||
(In thousands) | |||||
Water | $ | $ | $ | ||
Emerging Technologies | |||||
Corporate | |||||
Total depreciation and amortization | $ | $ | $ |
Years Ended December 31, | |||||
2023 | 2022 | 2021 | |||
Revenue by geographic location: | |||||
United States | |||||
International | |||||
Total revenue | |||||
Product revenue by country:(1) | |||||
Saudi Arabia | |||||
Algeria | ** | ** | |||
United Arab Emirates | ** | ||||
China | ** | ** | |||
Israel | ** | ** | |||
Others(2) | |||||
Total |
Years Ended December 31, | ||||||||
Segment | 2023 | 2022 | 2021 | |||||
Customer A | Water | ** | ** | |||||
Customer B | Water | ** | ||||||
Customer C | Water | ** | ** | |||||
Customer D | Water | ** | ||||||
Customer E | Water | ** | ** | |||||
Customer F | Water | ** | ** |
Years Ended December 31, | ||||||
2023 | 2022 | 2021 | ||||
Vendor A | ||||||
Vendor B | ||||||
Vendor C | ** | |||||
Vendor D | ** | ** |
Years Ended December 31, | |||||
2023 | 2022 | 2021 | |||
Weighted average expected life (years) | |||||
Weighted average expected volatility | |||||
Risk-free interest rate | |||||
Weighted average dividend yield |
Years Ended December 31, | |||||
2023 | 2022 | 2021 | |||
Stock options, stock appreciation rights and RSUs |
Years Ended December 31, | |||||
2023 | 2022 | 2021 | |||
(In thousands) | |||||
Stock-based compensation expense charged to: | |||||
Cost of revenue | $ | $ | $ | ||
General and administrative | |||||
Sales and marketing | |||||
Research and development | |||||
Total stock-based compensation expense | $ | $ | $ | ||
Stock-based compensation expense by type of award: | |||||
Stock options and stock appreciation rights | $ | $ | $ | ||
RSUs | |||||
Total stock-based compensation expense | $ | $ | $ |
Number of Shares | Weighted Average Exercise Price | Weighted Average Remaining Contractual Life | Aggregate Intrinsic Value(1) | ||||
(In thousands) | (Per share) | (In years) | (In thousands) | ||||
Balance, December 31, 2020 | $ | ||||||
Granted | |||||||
Exercised | ( | $ | |||||
Forfeited | ( | ||||||
Balance, December 31, 2021 | |||||||
Granted | |||||||
Exercised | ( | ||||||
Forfeited | ( | ||||||
Balance, December 31, 2022 | |||||||
Granted | |||||||
Exercised | ( | ||||||
Forfeited | |||||||
Balance, December 31, 2023 | $ | $ | |||||
Vested and exercisable as of December 31, 2023 | $ | $ | |||||
Vested and exercisable as of December 31, 2023 and expected to vest thereafter | $ | $ |
Number of Shares | Weighted Average Grant Date Fair Value | ||
(In thousands) | (Per share) | ||
Balance, December 31, 2020 | $ | ||
Awarded | |||
Vested | ( | ||
Forfeited | ( | ||
Balance, December 31, 2021 | |||
Awarded | |||
Vested | ( | ||
Forfeited | ( | ||
Balance, December 31, 2022 | |||
Awarded | |||
Vested | ( | ||
Forfeited | ( | ||
Balance, December 31, 2023 |
Years Ended December 31, | |||||
2023 | 2022 | 2021 | |||
(In thousands) | |||||
Stock options | $ | $ | $ | ||
RSUs | |||||
Total grant date fair value of stock options and RSUs vested during the period | $ | $ | $ |
Unamortized Compensation Costs | Weighted Average Service Period | ||
(In thousands) | (In years) | ||
Stock options | $ | ||
RSUs | |||
Total unamortized compensation costs, net of adjusted forfeitures | $ |
Name | Title | Date of Adoption or Termination (1) | Status (2) | Plan Type | ||||
Rule 10b5-1 trading arrangement (3) |
Plan Category | Number of Securities to be Issued Upon Exercise of Outstanding Options, Warrants, and Rights | Weighted- Average Exercise Price of Outstanding Options, Warrants, and Rights | Number of Securities Remaining Available for Future Issuance Under Equity Compensation Plans (Excluding Securities Reflected in the First Column) | |||
Equity compensation plans approved by security holders (1) | 2,800,543 | $11.54 | 4,098,928 | |||
Equity compensation plans not approved by security holders | None | Not applicable | Not applicable |
Exhibit Number | Exhibit Description | Incorporated by Reference | Filed Herewith | |||||||||
Form | File No. | Exhibit | Filing Date | |||||||||
10-Q | 001-34112 | 3.1 | 8/6/2021 | |||||||||
8-K | 001-34112 | 3.1 | 4/16/2021 | |||||||||
10-K | 001-34112 | 4.1 | 2/24/2022 | |||||||||
S-1/A | 333-150007 | 10.1 | 5/12/2008 | |||||||||
DEF14A | 001-34112 | Appendix A | 4/27/2012 | |||||||||
8-K | 001-34112 | 10.1 | 3/9/2012 | |||||||||
8-K | 001-34112 | 10.1 | 3/2/2016 | |||||||||
DEF14A | 001-34112 | Appendix A | 4/27/2016 | |||||||||
8-K | 001-34112 | 99.1 | 6/22/2016 | |||||||||
8-K | 001-34112 | 10.1 | 4/18/2018 | |||||||||
8-K | 001-34112 | 2.2 | 8/15/2018 | |||||||||
8-K | 001-34112 | 10.3 | 8/27/2018 | |||||||||
8-K | 001-34112 | 10.1 | 1/16/2019 | |||||||||
10.11 | 10-Q | 001-34112 | 10.1 | 5/1/2020 | ||||||||
8-K/A | 001-34112 | 10.1 | 5/22/2020 | |||||||||
X | ||||||||||||
10.14 | 8-K | 001-34112 | 10.1 | 2/10/2021 | ||||||||
10.15 | 8-K | 001-34112 | 10.1 | 1/6/2022 | ||||||||
10.16 | 10-Q | 001-34112 | 10.1 | 8/3/2022 | ||||||||
10.17 | 10-Q | 001-34112 | 10.1 | 11/1/2023 | ||||||||
10.18 | 8-K/A | 001-34112 | 10.1 | 1/31/2024 | ||||||||
10-K | 001-34112 | 14.1 | 3/27/2009 |
Exhibit Number | Exhibit Description | Incorporated by Reference | Filed Herewith | |||||||||
Form | File No. | Exhibit | Filing Date | |||||||||
X | ||||||||||||
X | ||||||||||||
X | ||||||||||||
X | ||||||||||||
X | ||||||||||||
X | ||||||||||||
101 | Inline XBRL Document Set for the consolidated financial statements and accompanying notes in Part II, Item 8, “Financial Statements and Supplementary Data” of this Annual Report on Form 10-K. | X | ||||||||||
104 | Inline XBRL for the cover page of this Annual Report on Form 10-K, included in the Exhibit 101 Inline XBRL Document Set. | X |
ENERGY RECOVERY, INC. | ||
/s/ DAVID W. MOON | ||
David W. Moon | ||
President and Chief Executive Officer |
Signature | Title | Date | ||
/s/ DAVID W. MOON | Director, and President and Chief Executive Officer | February 21, 2024 | ||
David W. Moon | (Principal Executive Officer) | |||
/s/ JOSHUA BALLARD | Chief Financial Officer | February 21, 2024 | ||
Joshua Ballard | (Principal Financial and Accounting Officer) | |||
/s/ PAMELA TONDREAU | Chairperson of the Board, Director | February 21, 2024 | ||
Pamela Tondreau | ||||
/s/ ALEXANDER J. BUEHLER | Director | February 21, 2024 | ||
Alexander J. Buehler | ||||
/s/ JOAN K. CHOW | Director | February 21, 2024 | ||
Joan K. Chow | ||||
/s/ ARVE HANSTVEIT | Director | February 21, 2024 | ||
Arve Hanstveit | ||||
/s/ ROBERT YU LANG MAO | Director | February 21, 2024 | ||
Robert Yu Lang Mao | ||||
/s/ COLIN R. SABOL | Director | February 21, 2024 | ||
Colin R. Sabol |