00014215172021FYfalsehttp://fasb.org/us-gaap/2021-01-31#ProductMemberhttp://fasb.org/us-gaap/2021-01-31#ProductMemberhttp://fasb.org/us-gaap/2021-01-31#ProductMemberhttp://fasb.org/us-gaap/2021-01-31#ProductMemberhttp://fasb.org/us-gaap/2021-01-31#ProductMemberhttp://fasb.org/us-gaap/2021-01-31#ProductMemberP3YP3YP1Y00014215172021-01-012021-12-3100014215172021-06-30iso4217:USD00014215172022-02-17xbrli:shares0001421517srt:MinimumMember2021-01-012021-12-3100014215172021-12-3100014215172020-12-31iso4217:USDxbrli:shares00014215172020-01-012020-12-3100014215172019-01-012019-12-310001421517us-gaap:ProductMember2021-01-012021-12-310001421517us-gaap:ProductMember2020-01-012020-12-310001421517us-gaap:ProductMember2019-01-012019-12-310001421517us-gaap:LicenseAndServiceMember2021-01-012021-12-310001421517us-gaap:LicenseAndServiceMember2020-01-012020-12-310001421517us-gaap:LicenseAndServiceMember2019-01-012019-12-310001421517us-gaap:CommonStockMember2020-12-310001421517us-gaap:CommonStockMember2019-12-310001421517us-gaap:CommonStockMember2018-12-310001421517us-gaap:CommonStockMember2021-01-012021-12-310001421517us-gaap:CommonStockMember2020-01-012020-12-310001421517us-gaap:CommonStockMember2019-01-012019-12-310001421517us-gaap:CommonStockMember2021-12-310001421517us-gaap:AdditionalPaidInCapitalMember2020-12-310001421517us-gaap:AdditionalPaidInCapitalMember2019-12-310001421517us-gaap:AdditionalPaidInCapitalMember2018-12-310001421517us-gaap:AdditionalPaidInCapitalMember2021-01-012021-12-310001421517us-gaap:AdditionalPaidInCapitalMember2020-01-012020-12-310001421517us-gaap:AdditionalPaidInCapitalMember2019-01-012019-12-310001421517us-gaap:AdditionalPaidInCapitalMember2021-12-310001421517us-gaap:AccumulatedOtherComprehensiveIncomeMember2020-12-310001421517us-gaap:AccumulatedOtherComprehensiveIncomeMember2019-12-310001421517us-gaap:AccumulatedOtherComprehensiveIncomeMember2018-12-310001421517us-gaap:AccumulatedOtherComprehensiveIncomeMember2021-01-012021-12-310001421517us-gaap:AccumulatedOtherComprehensiveIncomeMember2020-01-012020-12-310001421517us-gaap:AccumulatedOtherComprehensiveIncomeMember2019-01-012019-12-310001421517us-gaap:AccumulatedOtherComprehensiveIncomeMember2021-12-310001421517us-gaap:TreasuryStockMember2020-12-310001421517us-gaap:TreasuryStockMember2019-12-310001421517us-gaap:TreasuryStockMember2018-12-310001421517us-gaap:TreasuryStockMember2021-01-012021-12-310001421517us-gaap:TreasuryStockMember2020-01-012020-12-310001421517us-gaap:TreasuryStockMember2019-01-012019-12-310001421517us-gaap:TreasuryStockMember2021-12-310001421517us-gaap:RetainedEarningsMember2020-12-310001421517us-gaap:RetainedEarningsMember2019-12-310001421517us-gaap:RetainedEarningsMember2018-12-310001421517us-gaap:RetainedEarningsMember2021-01-012021-12-310001421517us-gaap:RetainedEarningsMember2020-01-012020-12-310001421517us-gaap:RetainedEarningsMember2019-01-012019-12-310001421517us-gaap:RetainedEarningsMember2021-12-3100014215172019-12-3100014215172018-12-310001421517srt:MaximumMember2021-01-012021-12-310001421517erii:EquipmentUsedInManufactureOfCeramicComponentsMember2021-01-012021-12-310001421517us-gaap:SoftwareAndSoftwareDevelopmentCostsMembersrt:MinimumMember2021-01-012021-12-310001421517us-gaap:SoftwareAndSoftwareDevelopmentCostsMembersrt:MaximumMember2021-01-012021-12-31xbrli:pure0001421517erii:PXPumpsAndTurboDevicesMembererii:WaterMember2021-01-012021-12-310001421517erii:PXPumpsAndTurboDevicesMembererii:EmergingTechnologiesSegmentMember2021-01-012021-12-310001421517erii:PXPumpsAndTurboDevicesMember2021-01-012021-12-310001421517erii:PXPumpsAndTurboDevicesMembererii:WaterMember2020-01-012020-12-310001421517erii:PXPumpsAndTurboDevicesMembererii:EmergingTechnologiesSegmentMember2020-01-012020-12-310001421517erii:PXPumpsAndTurboDevicesMember2020-01-012020-12-310001421517erii:PXPumpsAndTurboDevicesMembererii:WaterMember2019-01-012019-12-310001421517erii:PXPumpsAndTurboDevicesMembererii:EmergingTechnologiesSegmentMember2019-01-012019-12-310001421517erii:PXPumpsAndTurboDevicesMember2019-01-012019-12-310001421517erii:WaterMemberus-gaap:LicenseAndServiceMember2021-01-012021-12-310001421517us-gaap:LicenseAndServiceMembererii:EmergingTechnologiesSegmentMember2021-01-012021-12-310001421517erii:WaterMemberus-gaap:LicenseAndServiceMember2020-01-012020-12-310001421517us-gaap:LicenseAndServiceMembererii:EmergingTechnologiesSegmentMember2020-01-012020-12-310001421517erii:WaterMemberus-gaap:LicenseAndServiceMember2019-01-012019-12-310001421517us-gaap:LicenseAndServiceMembererii:EmergingTechnologiesSegmentMember2019-01-012019-12-310001421517erii:WaterMember2021-01-012021-12-310001421517erii:EmergingTechnologiesSegmentMember2021-01-012021-12-310001421517erii:WaterMember2020-01-012020-12-310001421517erii:EmergingTechnologiesSegmentMember2020-01-012020-12-310001421517erii:WaterMember2019-01-012019-12-310001421517erii:EmergingTechnologiesSegmentMember2019-01-012019-12-310001421517erii:WaterMembererii:MiddleEastAndAfricaMember2021-01-012021-12-310001421517erii:MiddleEastAndAfricaMembererii:EmergingTechnologiesSegmentMember2021-01-012021-12-310001421517erii:MiddleEastAndAfricaMember2021-01-012021-12-310001421517erii:WaterMembererii:MiddleEastAndAfricaMember2020-01-012020-12-310001421517erii:MiddleEastAndAfricaMembererii:EmergingTechnologiesSegmentMember2020-01-012020-12-310001421517erii:MiddleEastAndAfricaMember2020-01-012020-12-310001421517erii:WaterMembererii:MiddleEastAndAfricaMember2019-01-012019-12-310001421517erii:MiddleEastAndAfricaMembererii:EmergingTechnologiesSegmentMember2019-01-012019-12-310001421517erii:MiddleEastAndAfricaMember2019-01-012019-12-310001421517erii:WaterMembersrt:AsiaMember2021-01-012021-12-310001421517srt:AsiaMembererii:EmergingTechnologiesSegmentMember2021-01-012021-12-310001421517srt:AsiaMember2021-01-012021-12-310001421517erii:WaterMembersrt:AsiaMember2020-01-012020-12-310001421517srt:AsiaMembererii:EmergingTechnologiesSegmentMember2020-01-012020-12-310001421517srt:AsiaMember2020-01-012020-12-310001421517erii:WaterMembersrt:AsiaMember2019-01-012019-12-310001421517srt:AsiaMembererii:EmergingTechnologiesSegmentMember2019-01-012019-12-310001421517srt:AsiaMember2019-01-012019-12-310001421517erii:WaterMembersrt:EuropeMember2021-01-012021-12-310001421517srt:EuropeMembererii:EmergingTechnologiesSegmentMember2021-01-012021-12-310001421517srt:EuropeMember2021-01-012021-12-310001421517erii:WaterMembersrt:EuropeMember2020-01-012020-12-310001421517srt:EuropeMembererii:EmergingTechnologiesSegmentMember2020-01-012020-12-310001421517srt:EuropeMember2020-01-012020-12-310001421517erii:WaterMembersrt:EuropeMember2019-01-012019-12-310001421517srt:EuropeMembererii:EmergingTechnologiesSegmentMember2019-01-012019-12-310001421517srt:EuropeMember2019-01-012019-12-310001421517erii:WaterMembersrt:AmericasMember2021-01-012021-12-310001421517srt:AmericasMembererii:EmergingTechnologiesSegmentMember2021-01-012021-12-310001421517srt:AmericasMember2021-01-012021-12-310001421517erii:WaterMembersrt:AmericasMember2020-01-012020-12-310001421517srt:AmericasMembererii:EmergingTechnologiesSegmentMember2020-01-012020-12-310001421517srt:AmericasMember2020-01-012020-12-310001421517erii:WaterMembersrt:AmericasMember2019-01-012019-12-310001421517srt:AmericasMembererii:EmergingTechnologiesSegmentMember2019-01-012019-12-310001421517srt:AmericasMember2019-01-012019-12-310001421517erii:PXPumpsAndTurboDevicesMembererii:WaterMembererii:MegaprojectMember2021-01-012021-12-310001421517erii:PXPumpsAndTurboDevicesMembererii:MegaprojectMembererii:EmergingTechnologiesSegmentMember2021-01-012021-12-310001421517erii:PXPumpsAndTurboDevicesMembererii:MegaprojectMember2021-01-012021-12-310001421517erii:PXPumpsAndTurboDevicesMembererii:WaterMembererii:MegaprojectMember2020-01-012020-12-310001421517erii:PXPumpsAndTurboDevicesMembererii:MegaprojectMembererii:EmergingTechnologiesSegmentMember2020-01-012020-12-310001421517erii:PXPumpsAndTurboDevicesMembererii:MegaprojectMember2020-01-012020-12-310001421517erii:PXPumpsAndTurboDevicesMembererii:WaterMembererii:MegaprojectMember2019-01-012019-12-310001421517erii:PXPumpsAndTurboDevicesMembererii:MegaprojectMembererii:EmergingTechnologiesSegmentMember2019-01-012019-12-310001421517erii:PXPumpsAndTurboDevicesMembererii:MegaprojectMember2019-01-012019-12-310001421517erii:PXPumpsAndTurboDevicesMembererii:OriginalEquipmentManufacturerMembererii:WaterMember2021-01-012021-12-310001421517erii:PXPumpsAndTurboDevicesMembererii:OriginalEquipmentManufacturerMembererii:EmergingTechnologiesSegmentMember2021-01-012021-12-310001421517erii:PXPumpsAndTurboDevicesMembererii:OriginalEquipmentManufacturerMember2021-01-012021-12-310001421517erii:PXPumpsAndTurboDevicesMembererii:OriginalEquipmentManufacturerMembererii:WaterMember2020-01-012020-12-310001421517erii:PXPumpsAndTurboDevicesMembererii:OriginalEquipmentManufacturerMembererii:EmergingTechnologiesSegmentMember2020-01-012020-12-310001421517erii:PXPumpsAndTurboDevicesMembererii:OriginalEquipmentManufacturerMember2020-01-012020-12-310001421517erii:PXPumpsAndTurboDevicesMembererii:OriginalEquipmentManufacturerMembererii:WaterMember2019-01-012019-12-310001421517erii:PXPumpsAndTurboDevicesMembererii:OriginalEquipmentManufacturerMembererii:EmergingTechnologiesSegmentMember2019-01-012019-12-310001421517erii:PXPumpsAndTurboDevicesMembererii:OriginalEquipmentManufacturerMember2019-01-012019-12-310001421517erii:AftermarketMembererii:PXPumpsAndTurboDevicesMembererii:WaterMember2021-01-012021-12-310001421517erii:AftermarketMembererii:PXPumpsAndTurboDevicesMembererii:EmergingTechnologiesSegmentMember2021-01-012021-12-310001421517erii:AftermarketMembererii:PXPumpsAndTurboDevicesMember2021-01-012021-12-310001421517erii:AftermarketMembererii:PXPumpsAndTurboDevicesMembererii:WaterMember2020-01-012020-12-310001421517erii:AftermarketMembererii:PXPumpsAndTurboDevicesMembererii:EmergingTechnologiesSegmentMember2020-01-012020-12-310001421517erii:AftermarketMembererii:PXPumpsAndTurboDevicesMember2020-01-012020-12-310001421517erii:AftermarketMembererii:PXPumpsAndTurboDevicesMembererii:WaterMember2019-01-012019-12-310001421517erii:AftermarketMembererii:PXPumpsAndTurboDevicesMembererii:EmergingTechnologiesSegmentMember2019-01-012019-12-310001421517erii:AftermarketMembererii:PXPumpsAndTurboDevicesMember2019-01-012019-12-310001421517erii:VorTeqLicenseAgreementMemberus-gaap:LicenseAndServiceMembersrt:AffiliatedEntityMembererii:SchlumbergerTechnologyCorporationMember2015-10-142015-10-140001421517us-gaap:OilAndGasMembererii:VorTeqLicenseAgreementMemberus-gaap:LicenseAndServiceMembersrt:AffiliatedEntityMembererii:SchlumbergerTechnologyCorporationMember2020-04-012020-06-3000014215172022-10-012021-12-310001421517us-gaap:AllowanceForCreditLossMember2020-12-310001421517us-gaap:AllowanceForCreditLossMember2019-12-310001421517us-gaap:AllowanceForCreditLossMember2018-12-310001421517us-gaap:AllowanceForCreditLossMember2021-01-012021-12-310001421517us-gaap:AllowanceForCreditLossMember2020-01-012020-12-310001421517us-gaap:AllowanceForCreditLossMember2019-01-012019-12-310001421517us-gaap:AllowanceForCreditLossMember2021-12-310001421517us-gaap:MachineryAndEquipmentMember2021-12-310001421517us-gaap:MachineryAndEquipmentMember2020-12-310001421517us-gaap:LeaseholdImprovementsMember2021-12-310001421517us-gaap:LeaseholdImprovementsMember2020-12-310001421517us-gaap:SoftwareAndSoftwareDevelopmentCostsMember2021-12-310001421517us-gaap:SoftwareAndSoftwareDevelopmentCostsMember2020-12-310001421517us-gaap:FurnitureAndFixturesMember2021-12-310001421517us-gaap:FurnitureAndFixturesMember2020-12-310001421517us-gaap:AutomobilesMember2021-12-310001421517us-gaap:AutomobilesMember2020-12-310001421517us-gaap:ConstructionInProgressMember2021-12-310001421517us-gaap:ConstructionInProgressMember2020-12-310001421517us-gaap:MoneyMarketFundsMemberus-gaap:FairValueInputsLevel1Memberus-gaap:CashAndCashEquivalentsMember2021-12-310001421517us-gaap:MoneyMarketFundsMemberus-gaap:FairValueInputsLevel1Memberus-gaap:CashAndCashEquivalentsMember2020-12-310001421517us-gaap:CashAndCashEquivalentsMember2021-12-310001421517us-gaap:CashAndCashEquivalentsMember2020-12-310001421517us-gaap:ShortTermInvestmentsMemberus-gaap:FairValueInputsLevel2Memberus-gaap:USTreasurySecuritiesMember2021-12-310001421517us-gaap:ShortTermInvestmentsMemberus-gaap:FairValueInputsLevel2Memberus-gaap:USTreasurySecuritiesMember2020-12-310001421517us-gaap:ShortTermInvestmentsMemberus-gaap:CorporateDebtSecuritiesMemberus-gaap:FairValueInputsLevel2Member2021-12-310001421517us-gaap:ShortTermInvestmentsMemberus-gaap:CorporateDebtSecuritiesMemberus-gaap:FairValueInputsLevel2Member2020-12-310001421517us-gaap:ShortTermInvestmentsMember2021-12-310001421517us-gaap:ShortTermInvestmentsMember2020-12-310001421517us-gaap:CorporateDebtSecuritiesMembererii:LongtermInvestmentMemberus-gaap:FairValueInputsLevel2Member2021-12-310001421517us-gaap:CorporateDebtSecuritiesMembererii:LongtermInvestmentMemberus-gaap:FairValueInputsLevel2Member2020-12-310001421517erii:LongtermInvestmentMember2021-12-310001421517erii:LongtermInvestmentMember2020-12-310001421517erii:ShortTermAndLongTermInvestmentsMember2021-12-310001421517erii:ShortTermAndLongTermInvestmentsMember2020-12-310001421517us-gaap:FairValueMeasurementsRecurringMember2020-12-310001421517us-gaap:FairValueMeasurementsRecurringMember2021-12-310001421517us-gaap:FairValueInputsLevel3Memberus-gaap:FairValueMeasurementsRecurringMember2021-12-310001421517us-gaap:FairValueInputsLevel3Memberus-gaap:FairValueMeasurementsRecurringMember2020-12-310001421517us-gaap:CorporateDebtSecuritiesMember2021-12-310001421517us-gaap:CorporateDebtSecuritiesMember2020-12-310001421517us-gaap:CorporateDebtSecuritiesMember2021-01-012021-12-310001421517us-gaap:CorporateDebtSecuritiesMember2020-01-012020-12-310001421517us-gaap:LineOfCreditMembererii:JPMorganChaseBankNAMembererii:CommittedRevolvingCreditLineMember2021-12-220001421517us-gaap:LineOfCreditMembererii:JPMorganChaseBankNAMembererii:CommittedRevolvingCreditLineMember2021-12-222021-12-220001421517us-gaap:LineOfCreditMemberus-gaap:LondonInterbankOfferedRateLIBORMember2021-12-310001421517us-gaap:LineOfCreditMemberus-gaap:LondonInterbankOfferedRateLIBORMembersrt:MinimumMember2021-01-012021-12-310001421517us-gaap:LineOfCreditMemberus-gaap:LondonInterbankOfferedRateLIBORMembersrt:MaximumMember2021-01-012021-12-310001421517us-gaap:LineOfCreditMemberus-gaap:EurodollarMembersrt:MinimumMember2021-01-012021-12-310001421517us-gaap:LineOfCreditMemberus-gaap:EurodollarMembersrt:MaximumMember2021-01-012021-12-310001421517erii:EventOfDefaultMemberus-gaap:LineOfCreditMember2021-01-012021-12-310001421517us-gaap:LineOfCreditMembererii:CommittedRevolvingCreditLineMember2021-12-310001421517us-gaap:StandbyLettersOfCreditMember2021-12-310001421517us-gaap:StandbyLettersOfCreditMembersrt:MaximumMember2021-01-012021-12-310001421517us-gaap:StandbyLettersOfCreditMember2020-12-310001421517us-gaap:LineOfCreditMembererii:CommittedRevolvingCreditLineMembererii:LoanAndPledgeAgreementMembererii:CitibankNAMember2017-01-270001421517us-gaap:LineOfCreditMembererii:UncommittedRevolvingCreditLineMembererii:LoanAndPledgeAgreementMembererii:CitibankNAMember2017-01-270001421517erii:LoanAndPledgeAgreementMemberus-gaap:StandbyLettersOfCreditMembererii:CitibankNAMember2021-12-222021-12-220001421517us-gaap:IndemnificationGuaranteeMember2020-12-310001421517us-gaap:IndemnificationGuaranteeMember2021-12-310001421517srt:WeightedAverageMember2021-01-012021-12-310001421517us-gaap:CaliforniaFranchiseTaxBoardMember2021-12-310001421517us-gaap:InternalRevenueServiceIRSMember2021-12-310001421517us-gaap:InternalRevenueServiceIRSMember2020-12-310001421517us-gaap:CaliforniaFranchiseTaxBoardMember2020-12-310001421517us-gaap:RevenueCommissionersIrelandMember2021-12-310001421517us-gaap:RevenueCommissionersIrelandMember2020-12-310001421517us-gaap:InternalRevenueServiceIRSMembererii:ResearchAndDevelopmentMinimumTaxandForeignTaxCreditCarryforwardMember2021-12-310001421517us-gaap:InternalRevenueServiceIRSMembererii:ResearchAndDevelopmentMinimumTaxandForeignTaxCreditCarryforwardMember2020-12-310001421517us-gaap:CaliforniaFranchiseTaxBoardMembererii:ResearchAndDevelopmentMinimumTaxandForeignTaxCreditCarryforwardMember2021-12-310001421517us-gaap:CaliforniaFranchiseTaxBoardMembererii:ResearchAndDevelopmentMinimumTaxandForeignTaxCreditCarryforwardMember2020-12-310001421517erii:ResearchAndDevelopmentMinimumTaxandForeignTaxCreditCarryforwardMember2021-12-310001421517erii:ResearchAndDevelopmentMinimumTaxandForeignTaxCreditCarryforwardMember2020-12-310001421517erii:March2021AuthorizationMember2021-03-090001421517erii:March2021AuthorizationMember2021-01-012021-12-310001421517erii:March2021AuthorizationMember2021-12-310001421517erii:A2020IncentivePlanMember2021-12-310001421517erii:A2020IncentivePlanMembererii:EmployeeStockOptionsCreatedUnderNewPlanMember2021-12-310001421517erii:A2020IncentivePlanMembererii:EmployeeStockOptionsUnissuedUnderPriorPlanMember2021-12-310001421517erii:PredecessorPlansMember2021-12-310001421517erii:NonEmployeeBoardOfDirectorsMember2021-01-012021-12-310001421517us-gaap:RestrictedStockMember2021-12-310001421517us-gaap:RestrictedStockUnitsRSUMember2021-01-012021-12-310001421517us-gaap:RestrictedStockUnitsRSUMember2019-01-012019-12-310001421517us-gaap:EmployeeStockOptionMember2021-01-012021-12-310001421517us-gaap:EmployeeStockOptionMember2020-01-012020-12-310001421517us-gaap:EmployeeStockOptionMember2019-01-012019-12-310001421517srt:MinimumMemberus-gaap:EmployeeStockOptionMember2021-01-012021-12-310001421517us-gaap:EmployeeStockOptionMembersrt:MaximumMember2021-01-012021-12-310001421517srt:MinimumMemberus-gaap:EmployeeStockOptionMember2020-01-012020-12-310001421517us-gaap:EmployeeStockOptionMembersrt:MaximumMember2020-01-012020-12-310001421517srt:MinimumMemberus-gaap:EmployeeStockOptionMember2019-01-012019-12-310001421517us-gaap:EmployeeStockOptionMembersrt:MaximumMember2019-01-012019-12-310001421517us-gaap:CostOfSalesMember2021-01-012021-12-310001421517us-gaap:CostOfSalesMember2020-01-012020-12-310001421517us-gaap:CostOfSalesMember2019-01-012019-12-310001421517us-gaap:GeneralAndAdministrativeExpenseMember2021-01-012021-12-310001421517us-gaap:GeneralAndAdministrativeExpenseMember2020-01-012020-12-310001421517us-gaap:GeneralAndAdministrativeExpenseMember2019-01-012019-12-310001421517us-gaap:SellingAndMarketingExpenseMember2021-01-012021-12-310001421517us-gaap:SellingAndMarketingExpenseMember2020-01-012020-12-310001421517us-gaap:SellingAndMarketingExpenseMember2019-01-012019-12-310001421517us-gaap:ResearchAndDevelopmentExpenseMember2021-01-012021-12-310001421517us-gaap:ResearchAndDevelopmentExpenseMember2020-01-012020-12-310001421517us-gaap:ResearchAndDevelopmentExpenseMember2019-01-012019-12-310001421517us-gaap:RestrictedStockUnitsRSUMember2020-01-012020-12-310001421517erii:A2019ModificationsMember2019-01-012019-12-310001421517erii:A4YearEmployeeStockOptionsMember2021-01-012021-12-310001421517erii:A4YearEmployeeStockOptionsMember2020-01-012020-12-310001421517erii:A4YearEmployeeStockOptionsMember2019-01-012019-12-310001421517us-gaap:EmployeeStockOptionMember2021-12-310001421517us-gaap:RestrictedStockUnitsRSUMember2021-12-310001421517us-gaap:RestrictedStockUnitsRSUMember2018-12-310001421517us-gaap:RestrictedStockUnitsRSUMember2019-12-310001421517us-gaap:RestrictedStockUnitsRSUMember2020-12-310001421517erii:WaterMemberus-gaap:OperatingSegmentsMemberus-gaap:ProductMember2021-01-012021-12-310001421517us-gaap:OilAndGasMemberus-gaap:OperatingSegmentsMemberus-gaap:ProductMember2021-01-012021-12-310001421517us-gaap:OperatingSegmentsMemberus-gaap:ProductMember2021-01-012021-12-310001421517erii:WaterMemberus-gaap:OperatingSegmentsMemberus-gaap:ProductMember2020-01-012020-12-310001421517us-gaap:OilAndGasMemberus-gaap:OperatingSegmentsMemberus-gaap:ProductMember2020-01-012020-12-310001421517us-gaap:OperatingSegmentsMemberus-gaap:ProductMember2020-01-012020-12-310001421517erii:WaterMemberus-gaap:OperatingSegmentsMemberus-gaap:ProductMember2019-01-012019-12-310001421517us-gaap:OilAndGasMemberus-gaap:OperatingSegmentsMemberus-gaap:ProductMember2019-01-012019-12-310001421517us-gaap:OperatingSegmentsMemberus-gaap:ProductMember2019-01-012019-12-310001421517erii:WaterMemberus-gaap:OperatingSegmentsMemberus-gaap:LicenseAndServiceMember2021-01-012021-12-310001421517us-gaap:OilAndGasMemberus-gaap:OperatingSegmentsMemberus-gaap:LicenseAndServiceMember2021-01-012021-12-310001421517us-gaap:OperatingSegmentsMemberus-gaap:LicenseAndServiceMember2021-01-012021-12-310001421517erii:WaterMemberus-gaap:OperatingSegmentsMemberus-gaap:LicenseAndServiceMember2020-01-012020-12-310001421517us-gaap:OilAndGasMemberus-gaap:OperatingSegmentsMemberus-gaap:LicenseAndServiceMember2020-01-012020-12-310001421517us-gaap:OperatingSegmentsMemberus-gaap:LicenseAndServiceMember2020-01-012020-12-310001421517erii:WaterMemberus-gaap:OperatingSegmentsMemberus-gaap:LicenseAndServiceMember2019-01-012019-12-310001421517us-gaap:OilAndGasMemberus-gaap:OperatingSegmentsMemberus-gaap:LicenseAndServiceMember2019-01-012019-12-310001421517us-gaap:OperatingSegmentsMemberus-gaap:LicenseAndServiceMember2019-01-012019-12-310001421517erii:WaterMemberus-gaap:OperatingSegmentsMember2021-01-012021-12-310001421517us-gaap:OilAndGasMemberus-gaap:OperatingSegmentsMember2021-01-012021-12-310001421517us-gaap:OperatingSegmentsMember2021-01-012021-12-310001421517erii:WaterMemberus-gaap:OperatingSegmentsMember2020-01-012020-12-310001421517us-gaap:OilAndGasMemberus-gaap:OperatingSegmentsMember2020-01-012020-12-310001421517us-gaap:OperatingSegmentsMember2020-01-012020-12-310001421517erii:WaterMemberus-gaap:OperatingSegmentsMember2019-01-012019-12-310001421517us-gaap:OilAndGasMemberus-gaap:OperatingSegmentsMember2019-01-012019-12-310001421517us-gaap:OperatingSegmentsMember2019-01-012019-12-310001421517us-gaap:CorporateNonSegmentMember2021-01-012021-12-310001421517us-gaap:CorporateNonSegmentMember2020-01-012020-12-310001421517us-gaap:CorporateNonSegmentMember2019-01-012019-12-310001421517us-gaap:CustomerConcentrationRiskMemberus-gaap:SalesRevenueNetMembercountry:US2021-01-012021-12-310001421517us-gaap:CustomerConcentrationRiskMemberus-gaap:SalesRevenueNetMembercountry:US2020-01-012020-12-310001421517us-gaap:CustomerConcentrationRiskMemberus-gaap:SalesRevenueNetMembercountry:US2019-01-012019-12-310001421517us-gaap:CustomerConcentrationRiskMemberus-gaap:NonUsMemberus-gaap:SalesRevenueNetMember2021-01-012021-12-310001421517us-gaap:CustomerConcentrationRiskMemberus-gaap:NonUsMemberus-gaap:SalesRevenueNetMember2020-01-012020-12-310001421517us-gaap:CustomerConcentrationRiskMemberus-gaap:NonUsMemberus-gaap:SalesRevenueNetMember2019-01-012019-12-310001421517us-gaap:CustomerConcentrationRiskMemberus-gaap:SalesRevenueNetMember2021-01-012021-12-310001421517us-gaap:CustomerConcentrationRiskMemberus-gaap:SalesRevenueNetMember2020-01-012020-12-310001421517us-gaap:CustomerConcentrationRiskMemberus-gaap:SalesRevenueNetMember2019-01-012019-12-310001421517country:SAus-gaap:CustomerConcentrationRiskMemberus-gaap:SalesRevenueNetMember2021-01-012021-12-310001421517country:SAus-gaap:CustomerConcentrationRiskMemberus-gaap:SalesRevenueNetMember2020-01-012020-12-310001421517country:SAus-gaap:CustomerConcentrationRiskMemberus-gaap:SalesRevenueNetMember2019-01-012019-12-310001421517us-gaap:CustomerConcentrationRiskMemberus-gaap:SalesRevenueNetMembercountry:AE2021-01-012021-12-310001421517us-gaap:CustomerConcentrationRiskMemberus-gaap:SalesRevenueNetMembercountry:AE2020-01-012020-12-310001421517us-gaap:CustomerConcentrationRiskMemberus-gaap:SalesRevenueNetMembercountry:AE2019-01-012019-12-310001421517us-gaap:CustomerConcentrationRiskMemberus-gaap:SalesRevenueNetMembercountry:IL2021-01-012021-12-310001421517us-gaap:CustomerConcentrationRiskMemberus-gaap:SalesRevenueNetMembercountry:EG2020-01-012020-12-310001421517us-gaap:CustomerConcentrationRiskMembererii:OthersMemberus-gaap:SalesRevenueNetMember2021-01-012021-12-310001421517us-gaap:CustomerConcentrationRiskMembererii:OthersMemberus-gaap:SalesRevenueNetMember2020-01-012020-12-310001421517us-gaap:CustomerConcentrationRiskMembererii:OthersMemberus-gaap:SalesRevenueNetMember2019-01-012019-12-310001421517us-gaap:CustomerConcentrationRiskMembererii:WaterMemberus-gaap:SalesRevenueNetMembererii:CustomerAMember2021-01-012021-12-310001421517us-gaap:CustomerConcentrationRiskMembererii:WaterMemberus-gaap:SalesRevenueNetMembererii:CustomerAMember2020-01-012020-12-310001421517us-gaap:CustomerConcentrationRiskMembererii:CustomerBMembererii:WaterMemberus-gaap:SalesRevenueNetMember2021-01-012021-12-310001421517erii:CustomerCMemberus-gaap:CustomerConcentrationRiskMembererii:WaterMemberus-gaap:SalesRevenueNetMember2021-01-012021-12-310001421517us-gaap:CustomerConcentrationRiskMembererii:WaterMemberus-gaap:SalesRevenueNetMembererii:CustomerDMember2021-01-012021-12-310001421517us-gaap:CustomerConcentrationRiskMembererii:WaterMemberus-gaap:SalesRevenueNetMembererii:CustomerDMember2020-01-012020-12-310001421517us-gaap:CustomerConcentrationRiskMembererii:WaterMemberus-gaap:SalesRevenueNetMembererii:CustomerDMember2019-01-012019-12-310001421517us-gaap:RevenueFromContractWithCustomerMemberus-gaap:CustomerConcentrationRiskMemberus-gaap:LicenseAndServiceMember2020-01-012020-12-310001421517us-gaap:AccountsPayableMemberus-gaap:CustomerConcentrationRiskMembererii:VendorAMember2021-01-012021-12-310001421517us-gaap:AccountsPayableMemberus-gaap:CustomerConcentrationRiskMembererii:VendorAMember2020-01-012020-12-310001421517us-gaap:AccountsPayableMemberus-gaap:CustomerConcentrationRiskMembererii:VendorBMember2021-01-012021-12-310001421517us-gaap:AccountsPayableMemberus-gaap:CustomerConcentrationRiskMembererii:VendorBMember2020-01-012020-12-310001421517us-gaap:AccountsPayableMemberus-gaap:CustomerConcentrationRiskMembererii:VendorCMember2021-01-012021-12-31
UNITED STATES
SECURITIES AND EXCHANGE COMMISSION
Washington D.C. 20549
Form 10-K
| | | | | | | | |
| (Mark One) | |
| ☒ | ANNUAL REPORT PURSUANT TO SECTION 13 OR 15(d) OF THE SECURITIES EXCHANGE ACT OF 1934 |
For the fiscal year ended December 31, 2021
or
| | | | | | | | |
| ☐ | TRANSITION REPORT PURSUANT TO SECTION 13 OR 15(d) OF THE SECURITIES EXCHANGE ACT OF 1934 |
For the transition period from _____ to _____
Commission File Number: 001-34112
| | | | | | | | |
| Energy Recovery, Inc. | |
| (Exact Name of Registrant as Specified in its Charter) | |
| | | | | | | | | | | | | | | | | | | | | | | | | | | | | |
| Delaware | | | | | 01-0616867 | |
| (State or Other Jurisdiction of Incorporation) | | | | | (I.R.S. Employer Identification No.) | |
1717 Doolittle Drive
San Leandro, California 94577
(Address of Principal Executive Offices) (Zip Code)
(510) 483-7370
(Registrant’s telephone number, including area code)
Securities registered pursuant to Section 12(b) of the Securities Exchange Act of 1934:
| | | | | | | | | | | | | | |
| Title of each class | | Trading Symbol | | Name of each exchange on which registered |
| Common Stock, $0.001 par value | | ERII | | The Nasdaq Stock Market LLC |
Securities registered pursuant to Section 12(g) of the Act: None
Indicate by check mark whether the registrant is a well-known seasoned issuer, as defined in Rule 405 of the Securities Act. Yes ☐ No ☑
Indicate by check mark if the registrant is not required to file reports pursuant to Section 13 or Section 15(d) of the Act. Yes ☐ No ☑
Indicate by check mark whether the registrant (1) has filed all reports required to be filed by Section 13 or 15(d) of the Securities Exchange Act of 1934 during the preceding 12 months (or for such shorter period that the registrant was required to file such reports), and (2) has been subject to such filing requirements for the past 90 days. Yes ☑ No ☐
Indicate by check mark whether the registrant has submitted electronically every Interactive Data File required to be submitted pursuant to Rule 405 of Regulation S-T (§ 232.405 of this chapter) during the preceding 12 months (or for such shorter period that the registrant was required to submit such files). Yes ☑ No ☐
Indicate by check mark whether the registrant is a large accelerated filer, an accelerated filer, a non-accelerated filer, or a smaller reporting company. See the definitions of “large accelerated filer,” “accelerated filer,” “smaller reporting company,” and “emerging growth company” in Rule 12b-2 of the Exchange Act:
Large accelerated filer ☑ Accelerated filer ☐ Non-accelerated filer ☐ Smaller reporting company ☐ Emerging growth company ☐
If an emerging growth company, indicate by check mark if the registrant has elected not to use the extended transition period for complying with any new or revised financial accounting standards provided pursuant to Section 13(a) of the Exchange Act. ☐
Indicate by check mark whether the registrant has filed a report on and attestation to its management’s assessment of the effectiveness of its internal control over financial reporting under Section 404(b) of the Sarbanes-Oxley Act (15 U.S.C. 7262(b)) by the registered public accounting firm that prepared or issued its audit report. ☑
Indicate by check mark whether the registrant is a shell company (as defined in Rule 12b-2 of the Act). Yes ☐ No ☑
The aggregate market value of the voting stock held by non-affiliates amounted to approximately $1.12 billion on June 30, 2021.
The number of shares of the registrant’s common stock outstanding as of February 17, 2022 was 56,810,449 shares.
DOCUMENTS INCORPORATED BY REFERENCE
As noted herein, the information called for by Part III is incorporated by reference to specified portions of the registrant’s definitive proxy statement to be filed in conjunction with the registrant’s 2022 Annual Meeting of Stockholders, which is expected to be filed not later than 120 days after the registrant’s fiscal year ended December 31, 2021.
TABLE OF CONTENTS
Energy Recovery, Inc. | 2021 Form 10-K Annual Report
Forward-Looking Information
This Annual Report on Form 10-K for the year ended December 31, 2021, including Part II, Item 7, “Management’s Discussion and Analysis of Financial Condition and Results of Operations” (the “MD&A”) and certain information incorporated by reference, contain forward-looking statements within the “safe harbor” provisions of the Private Securities Litigation Reform Act of 1995. Forward-looking statements in this report include, but are not limited to, statements about our expectations, objectives, anticipations, plans, hopes, beliefs, intentions or strategies regarding the future.
Forward-looking statements represent our current expectations about future events, are based on assumptions, and involve risks and uncertainties. If the risks or uncertainties occur or the assumptions prove incorrect, then our results may differ materially from those set forth or implied by the forward-looking statements. Our forward-looking statements are not guarantees of future performance or events.
Words such as “expects,” “anticipates,” “aims,” “projects,” “intends,” “plans,” “believes,” “estimates,” “seeks,” “continue,” “could,” “may,” “potential,” “should,” “will,” “would,” variations of such words and similar expressions are also intended to identify such forward-looking statements. These forward-looking statements are subject to risks, uncertainties and assumptions that are difficult to predict; therefore, actual results may differ materially and adversely from those expressed in any forward-looking statements. Readers are directed to risks and uncertainties identified under Part I, Item 1A, “Risk Factors,” and elsewhere in this report for factors that may cause actual results to be different from those expressed in these forward-looking statements. Except as required by law, we undertake no obligation to revise or update publicly any forward-looking statements for any reason.
Forward-looking statements in this report include, without limitation, statements about the following:
•our belief that the pressure exchanger is the industry standard for energy recovery in the seawater reverse osmosis desalination (“SWRO”) industry;
•our belief that the scalability and versatility of our platform can help us achieve success in emerging markets similar to SWRO;
•our belief that the Ultra PX™ addresses key challenges associated with treating industrial wastewater in a range of reverse osmosis (“RO”) applications;
•our belief that the Ultra PX can accelerate adoption of RO in the growing zero liquid discharge (“ZLD”) and minimal liquid discharge (“MLD”) markets;
•our belief that the Ultra PX can help make RO the preferred treatment option to achieve ZLD and MLD requirements by enhancing RO’s affordability and efficiency compared to thermal treatment options.
•our estimate that our life-to-date installed energy recovery devices (“ERDs”) have saved water desalination customers approximately $2.6 billion in energy costs and helped our customers avoid over 26 terawatt-hours of energy usage, which represents approximately a 4% reduction in the global energy consumption for potable water utilities;
•our belief that pressure exchanger technology can provide benefits to our customers, including the reduction of capital expenditures and energy use;
•our belief that our pressure exchanger technology can address inefficiencies and waste within industrial systems and processes that involve high-pressure and low-pressure fluid flows;
•our belief that our PX® Pressure Exchanger® (“PX”) has helped make SWRO an economically viable and more sustainable option in the production of potable water;
•our belief that our hydraulic turbochargers (“Turbochargers”) deliver substantial savings and ease of integration into desalination systems;
•our anticipation that markets not traditionally associated with desalination, such as the United States of America (the “U.S.”) and China will inevitably develop and provide further revenue growth opportunities;
•our belief that countries around the world will continue to mandate ZLD or MLD requirements for specific industries;
•our belief that leveraging the Ultra PX with RO will significantly lower thermal demand;
•our belief that, as the existing thermal technology is replaced with RO technology, demand for our products will be created;
•our belief that ongoing operating costs rather than capital expenditures is the key factor in the selection of an ERD solution for megaproject (“MPD”) customers;
•our belief that our PX offers market-leading value with the highest technological and economic benefit;
•our estimate that MPD customer projects represent revenue opportunities from approximately $1 million to $21 million;
Energy Recovery, Inc. | 2021 Form 10-K Annual Report | FLS 1
•our estimate that the total capital investments by MPD customers in these large-scale infrastructure projects may range between $50 million to over $1 billion;
•our belief that initial capital expenditure rather than future ongoing operating costs is the key factor in the selection of an ERD solution for original equipment manufacturer (“OEM”) projects;
•our estimate that OEM customer projects represent revenue opportunities up to $1 million;
•our estimate that the total capital investments by OEM customers in these projects are typically up to $50 million;
•our belief that our solutions offer a competitive advantage compared to our competitors’ solutions because our ERDs provide the lowest life-cycle cost and are, therefore, the most cost-effective ERD solutions for RO desalination applications;
•our belief that our PX has a competitive advantage, as compared to the Flowserve Corporation’s DWEER product, because our devices are made with highly durable and corrosion-resistant aluminum oxide (“alumina”) ceramic parts that are designed for a life of more than 25 years, are warrantied for high efficiencies, and cause minimal unplanned downtime, resulting in lower lifecycle costs;
•our belief that our PX has a distinct competitive advantage over Fluid Equipment Development Company’s (“FEDCO”) turbochargers and Danfoss Group’s iSave ERDs because our devices provide up to 98% efficiency, have lower lifecycle maintenance costs, and are made of highly durable and corrosion-resistant alumina ceramic parts;
•our belief that our Turbochargers compete favorably with FEDCO’s turbochargers based on efficiency, price, and because our Turbochargers have design advantages that enhance efficiency, operational flexibility and serviceability;
•our belief that our pump solutions are competitive with our competitors because our pumps are developed specifically for RO desalination, are highly efficient, feature product-lubricated bearings, and are often purchased with our ERDs in small to medium-sized plants;
•our belief that leveraging our pressure exchanger technology will unlock new commercial opportunities in the future;
•our belief that sales of carbon dioxide (“CO2”) refrigeration systems will increase in response to regulations and supermarkets’ search for safe natural refrigerants;
•our belief that our pressure exchanger technology can significantly help reduce the operating costs of CO2 refrigeration systems by recycling the pressure energy of CO2 gas thereby significantly reducing the energy needed to operate these systems;
•our belief that the PX G1300 could eventually alter the standard refrigeration system architecture by reducing costs for retail end users such as grocery stores;
•our belief that we will be able to achieve efficiencies across a wider range of temperatures that exceed incumbent CO2 refrigeration technologies;
•our belief that the Ultra PX™ can address the key challenges associated with treating industrial wastewater in ultra high-pressure reverse osmosis (“UHPRO”) applications;
•our belief that the Ultra PX can help make UHPRO the preferred treatment option to achieve ZLD and MLD requirements by enhancing UHPRO’s affordability and efficiency compared to thermal treatment options;
•our belief that our Ultra PX enables customers to optimize their wastewater treatment process for ZLD and MLD;
•our belief that we can successfully find a suitable collaboration partner to commercialize the VorTeq™;
•our objective of finding new applications for our technology and developing new products for use outside of desalination;
•our belief that our current facilities will be adequate for the foreseeable future;
•our belief that by investing in research and development, we will be well positioned to continue to execute on our product strategy;
•our expectation that sales outside of the U.S. will remain a significant portion of our revenue;
•the timing of our receipt of payment for products or services from our customers;
•our belief that the integration of Environmental, Social and Governance (“ESG”) principles into our corporate and risk management strategies can strengthen our existing business as well as our efforts to develop new applications of pressure exchanger technology for high-pressure fluid-flow environments;
•our belief that our enhanced safety measures will allow us to help contain the spread of the novel coronavirus (“COVID-19”);
•the development of major public health concerns, including the COVID-19 outbreak or other pandemics arising globally, and the future impact of such major public health concerns, and specifically in the short-term the COVID-19 pandemic, on our business and operations;
Energy Recovery, Inc. | 2021 Form 10-K Annual Report | FLS 2
•our belief that our existing cash and cash equivalents, our short and/or long-term investments, and the ongoing cash generated from our operations, will be sufficient to meet our anticipated liquidity needs for the foreseeable future, with the exception of a decision to enter into an acquisition and/or fund investments in our latest technology arising from rapid market adoption that could require us to seek additional equity or debt financing;
•our expectation that, as we expand our international sales, a portion of our revenue could be denominated in foreign currencies and the impact of changes in exchange rates on our cash and operating results;
•our expectation of increased sales and marketing expenditures for 2022 and 2023;
•our expectation that we will be able to enforce our intellectual property (“IP”) rights;
•our expectation that the adoption of new accounting standards will not have a material impact on our financial position or results of operations;
•our share repurchase program will result in repurchases of our common stock or enhance long term stockholder value;
•the outcome of proceedings, lawsuits, disputes and claims;
•the impact of losses due to indemnification obligations;
•the impact of changes in internal control over financial reporting; and
•other factors disclosed under Part I, Item 1, “Business,” Item 1A, “Risk Factors,” and Item 2, “Properties,” and Part II, Item 7, MD&A, and Item 7A, “Quantitative and Qualitative Disclosures about Market Risk,” and elsewhere in this Form 10‑K.
You should not place undue reliance on these forward-looking statements, which reflect management’s opinions only as of the date of the filing of this Annual Report on Form 10-K. All forward-looking statements included in this document are subject to additional risks and uncertainties further discussed under Part I, Item 1A, “Risk Factors,” and are based on information available to us as of February 24, 2022. We assume no obligation to update any such forward-looking statements, certain risks and uncertainties which could cause actual results to differ materially from those projected in the forward-looking statements, as disclosed from time to time in our Annual Reports on Form 10‑K, Quarterly Reports on Form 10‑Q and Current Reports on Form 8‑K filed with or furnished to the Securities and Exchange Commission (the “SEC”), as well as in Part I, Item 1A, “Risk Factors,” within this Annual Report on Form 10-K. It is important to note that our actual results could differ materially from the results set forth or implied by our forward-looking statements. The factors that could cause our actual results to differ from those included in such forward-looking statements are set forth under the heading Item 1A, “Risk Factors,” in our Quarterly Reports on Form 10-Q, and in our Annual Reports on Form 10-K, and from time-to-time, in our results disclosed on our Current Reports on Form 8-K.
We provide our Annual Reports on Form 10‑K, Quarterly Reports on Form 10‑Q, Current Reports on Form 8‑K, Proxy Statements, Forms 3, 4 and 5 filed by or on behalf of directors, executive officers and certain large shareholders, and any amendments to those documents filed or furnished pursuant to the Securities Exchange Act of 1934, free of charge on the Investor Relations section of our website, www.energyrecovery.com. These filings will become available as soon as reasonably practicable after such material is electronically filed with or furnished to the SEC. From time to time, we may use our website as a channel of distribution of material company information.
We also make available in the Investor Relations section of our website our corporate governance documents including our code of business conduct and ethics and the charters of the audit, compensation and nominating and governance committees. These documents, as well as the information on the website, are not intended to be part of this Annual Report on Form 10-K. We use the Investor Relations section of our website as a means of complying with our disclosure obligations under Regulation FD. Accordingly, you should monitor the Investor Relations section of our website in addition to following our press releases, SEC filings and public conference calls and webcasts.
Energy Recovery, Inc. | 2021 Form 10-K Annual Report | FLS 3
PART I
Item 1 — Business
Overview
Energy Recovery, Inc. (the “Company”, “Energy Recovery”, “we”, “our” and “us”) designs and manufactures solutions that make industrial processes more efficient and sustainable. Leveraging our pressure exchanger technology, which generates little to no emissions when operating, our solutions lower costs, save energy, reduce waste and minimize emissions for companies across a variety of industrial processes. As the world coalesces around the urgent need to address climate change and its impacts, we are at the forefront on helping companies reduce their energy consumption in their industrial processes, which in turn, reduces their carbon footprint. We believe that our customers do not have to sacrifice quality and cost savings for sustainability and are committed to developing solutions that drive long-term value – both financial and environmental.
The original product application of our technology, the PX® Pressure Exchanger® (“PX”) energy recovery device (“ERD”), was a major contributor to the advancement of seawater reverse osmosis desalination (“SWRO”), significantly lowering the energy intensity and cost of water production globally from SWRO. The PX, which we believe is the industry standard for energy recovery in the SWRO industry, is up to 98% efficient, operates with minimal maintenance, and outlasts most other components of the system in which it is incorporated. We have since introduced our technology to the fast growing industrial wastewater (“IWW”) market, such as battery manufacturers, mining operations, and manufacturing plants that discharge wastewater with significant levels of metals and pollutants, as well as the commercial and industrial refrigeration market.
Engineering, and research and development (“R&D”), have been, and remain, an essential part of our history, culture and corporate strategy. Since our formation, we have developed leading technology and engineering expertise through the continual evolution of our pressure exchanger technology, which can enhance environmental sustainability and improve productivity by reducing waste and energy consumption in high-pressure industrial fluid-flow systems. This versatile technology works as a platform to build product applications and is at the heart of many of our products. In addition, we have engineered and developed ancillary devices, such as our hydraulic turbochargers (“Turbochargers”) and boosters, that complement our ERDs.
As discussed further under the Research, Development and Technology section under Part I, Item 1 of this report, today, we are applying our core technology in new and important ways, building new products to accelerate environmental sustainability across more industries.
We have been incorporated in the state of Delaware since 2001. Our headquarters and principal R&D and manufacturing facility is located in San Leandro, California. In addition, we have manufacturing and warehouse space in Tracy, California and manufacturing, testing and warehouse space in Katy, Texas. We are a global team with sales and worldwide on-site technical support. We maintain international direct sales offices and technical support centers to service customers in Europe, Latin America, the Middle East and Asia.
Energy Recovery, Inc. | 2021 Form 10-K Annual Report | 1
Environmental, Social and Governance Program
We released our second annual Environmental, Social and Governance (“ESG”) report, which details our efforts to accelerate the environmental sustainability of our customers’ operations and enhance the management of ESG issues in our own operations. The report provides examples and data illustrating our products’ positive environmental impacts across the industries where we operate. We understand the importance of being a responsible corporate citizen and believe our ESG program provides us with a strategic roadmap to become a more sustainable and resilient business. Our ESG report outlines our ESG goals and aligns to leading sustainability frameworks and reporting standards, including the Sustainability Accounting Standards Board as well as select disclosures from the Global Reporting Initiative and the United Nations Sustainable Development Goals. Our ESG efforts resulted in an increase in our MSCI, Inc. (“MSCI”) rating position from BBB to a rating of A in February 2021, leading to our inclusion in the MSCI USA Small Cap Leaders Index.
Our ESG goals were set following a materiality assessment and focus on four key ESG topics – Employees, Environmental & Climate Change Risks, Innovation & Opportunity and Products – that both we and key stakeholders identified as highly influential to our business success. Our top-line ESG goals are as follows:
Employees
•Develop workforce to deliver sustainable, diversified growth; and
•Protect the lives and livelihoods of our employees by providing a safe and healthy work environment,
Environmental & Climate Change Risks
•Report climate-related risk strategy and management aligned with the Task Force on Climate-related Financial Disclosures (“TCFD”) recommendations by the end of fiscal year 2024; and
•Certification to the International Organization for Standardization (“ISO”) 14001 environmental management standard by the end of 2022,
Innovation & Opportunity
•Double emissions reductions from our products by end the of fiscal year 2025 versus fiscal year 2019 baseline,
Products
•Deliver products and solutions customers can trust.
Our top-line ESG goals are paired with quantitative targets and key performance indicators to promote transparency and equip our stakeholders to hold us accountable for our ESG performance. With regards to our TCFD recommendations goal, the TCFD recommendations provide a structured approach to evaluating and communicating the potential impact climate change may have on our operations and financial results. We believe alignment with this framework represents the best path for our company to evolve our climate change risk management strategy over the next few years.
Furthermore, as part of our efforts to transparently communicate our ESG performance to our stakeholders, in September 2021, we hosted an ESG-focused webinar, “Charting Sustainable Growth with ESG Principles,” in which we discussed the highlights of our ESG program and how ESG is linked to driving long-term, sustainable growth for us and our stakeholders.
The on-demand webinar and our complete 2020 ESG report can be found on our website at: https://energyrecovery.com/about-us/environmental-social-governance/.
Markets
We offer a suite of products for the SWRO and IWW treatment industries, including ERDs, and high-pressure feed and recirculation pumps. We are also focused on applying our pressure exchanger technology to industries outside of desalination and IWW. We have introduced a solution to reduce energy consumption in natural gas processing and in refrigeration systems that use carbon dioxide (“CO2”), an environmentally sustainable alternative to traditional hydrofluorocarbon (“HFC”)-based systems.
Energy Recovery, Inc. | 2021 Form 10-K Annual Report | 2
The PX Technology
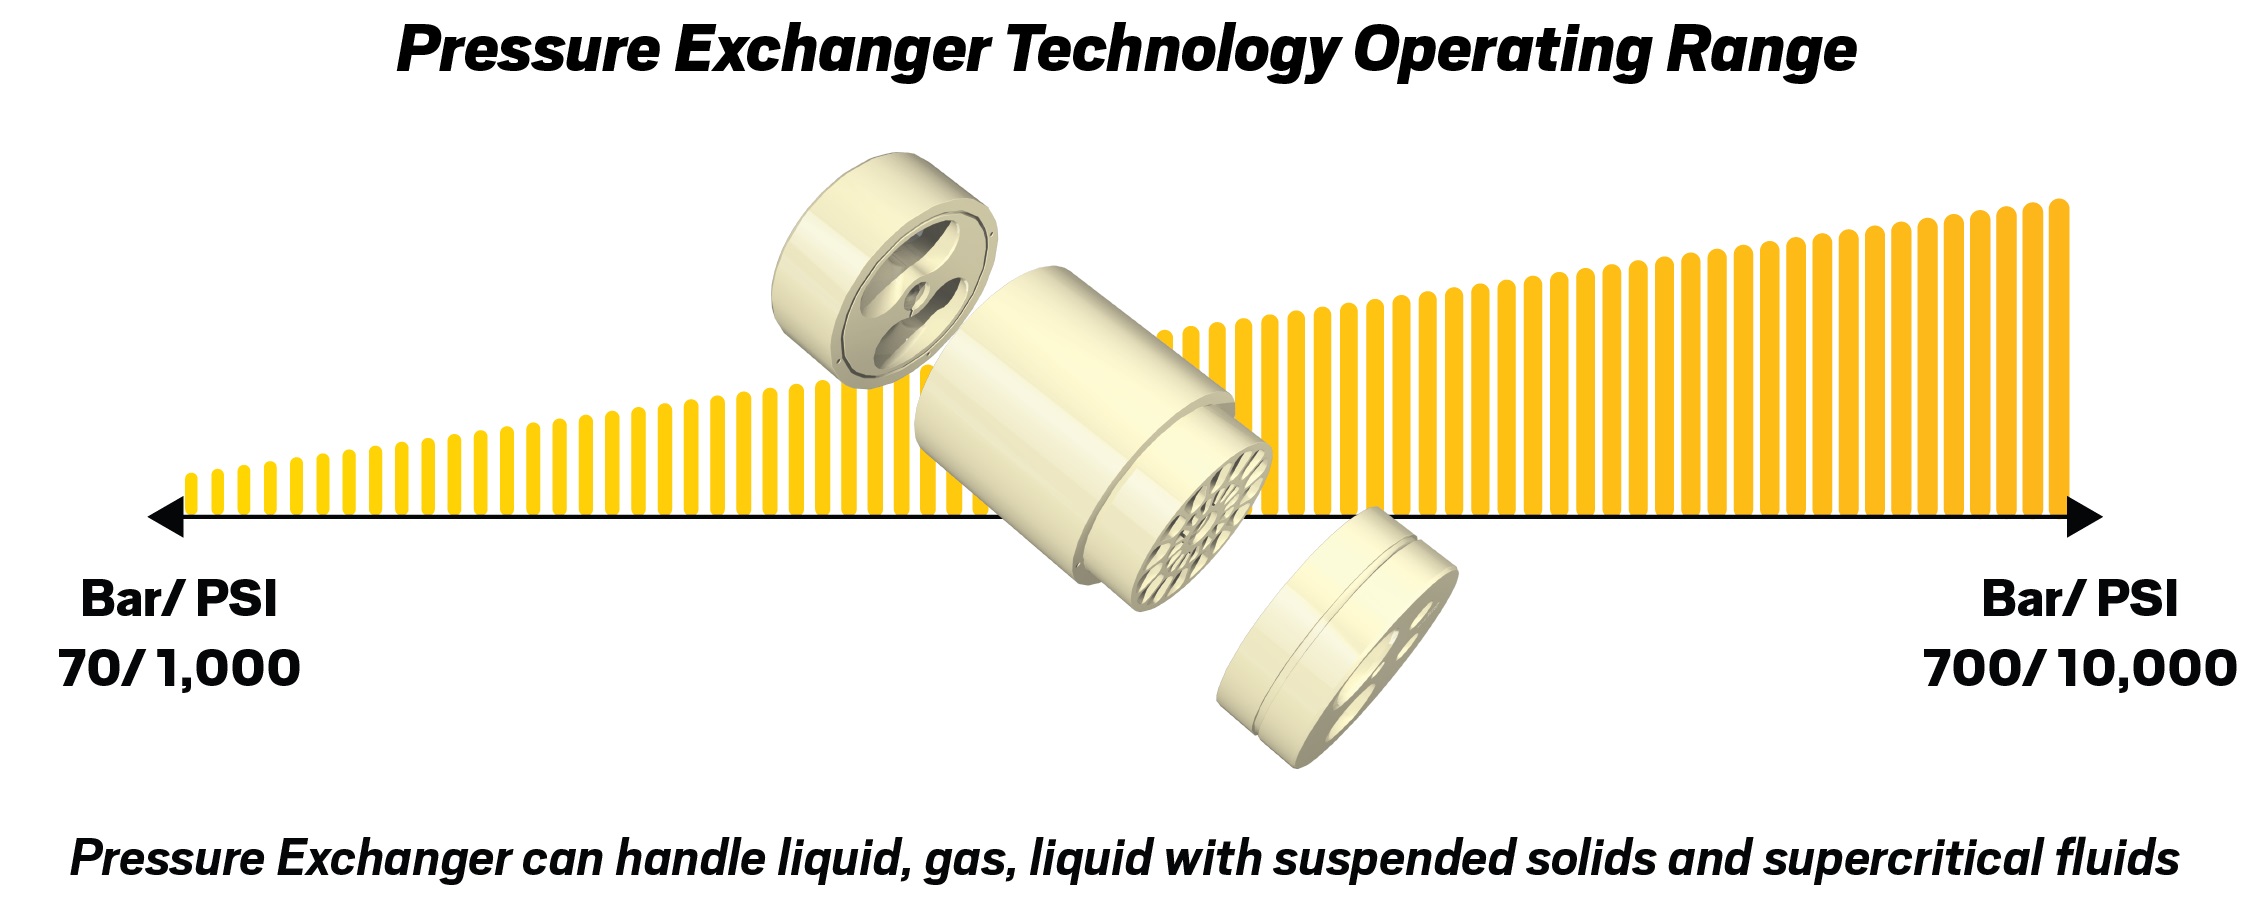
Our success has been built on the strength of our PX using our proprietary pressure exchanger technology platform. Our highly-developed pressure exchanger technology is capable of allowing our PX to recycle pressure energy by transferring this energy from one high pressure column of fluid (liquid or gas) to a low-pressure column of fluid. This technology platform is applicable to a wide-range of industries where high pressure fluids exist.
Our pressure exchanger technology is at the heart of many of the products we have developed and is the core solution to the industries in which we serve. Our pressure exchanger technology is what we center and structure our product applications, solutions, and services around. The pressure exchanger technology, which generates little to no emissions when operating, recycles otherwise wasted pressure energy within a variety of industrial systems, lowering costs, saving energy, reducing waste, while concurrently minimizing emissions and unplanned downtime.
The pressure exchanger technology is highly versatile and acts like a fluid piston, transferring liquid or gas energy ranging from operating pressures between 1,000 pounds per square inch (“psi”), or 70 bar, and as high as 10,000 psi, or 700 bar, through continuous batch process of pressure exchanges, with efficiencies up to 98%.
Our patented PX family of products leverages our pressure exchanger technology and includes a variety of sizes defined by the flow of the plant ranging as low as 20 gallons per minute and up to 300 gallons per minute per device; however, our customers can design their ERD systems to achieve unlimited capacities by installing our PX in parallel and in multiple arrays. Our technology has been deployed into the largest industrial and municipal water treatment plants in the world and we believe the scalability and versatility of our platform can achieve similar success in the emerging markets we are targeting.
Energy Recovery, Inc. | 2021 Form 10-K Annual Report | 3
Solutions
| | | | | |
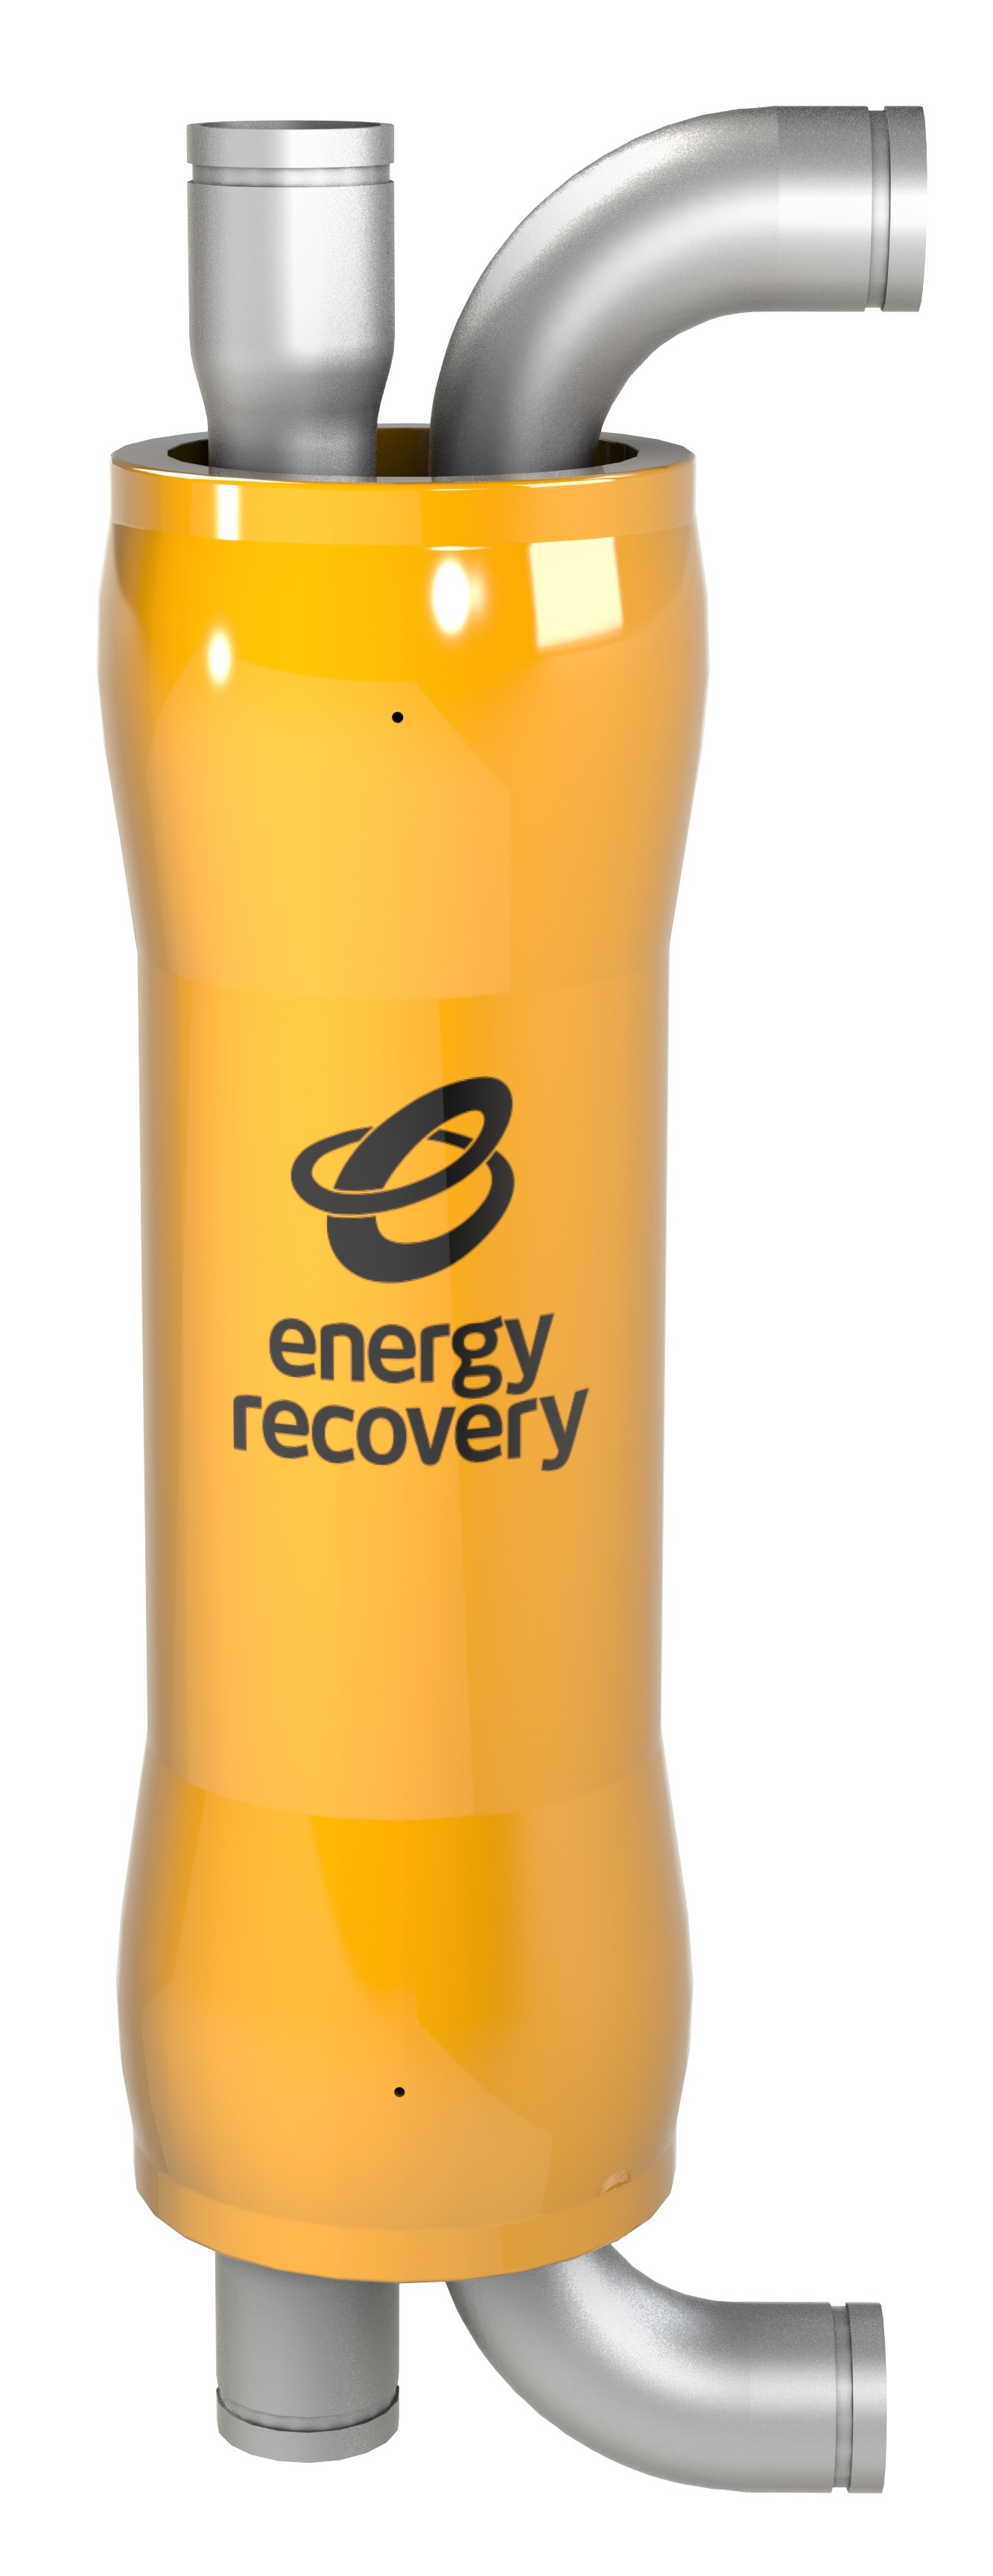
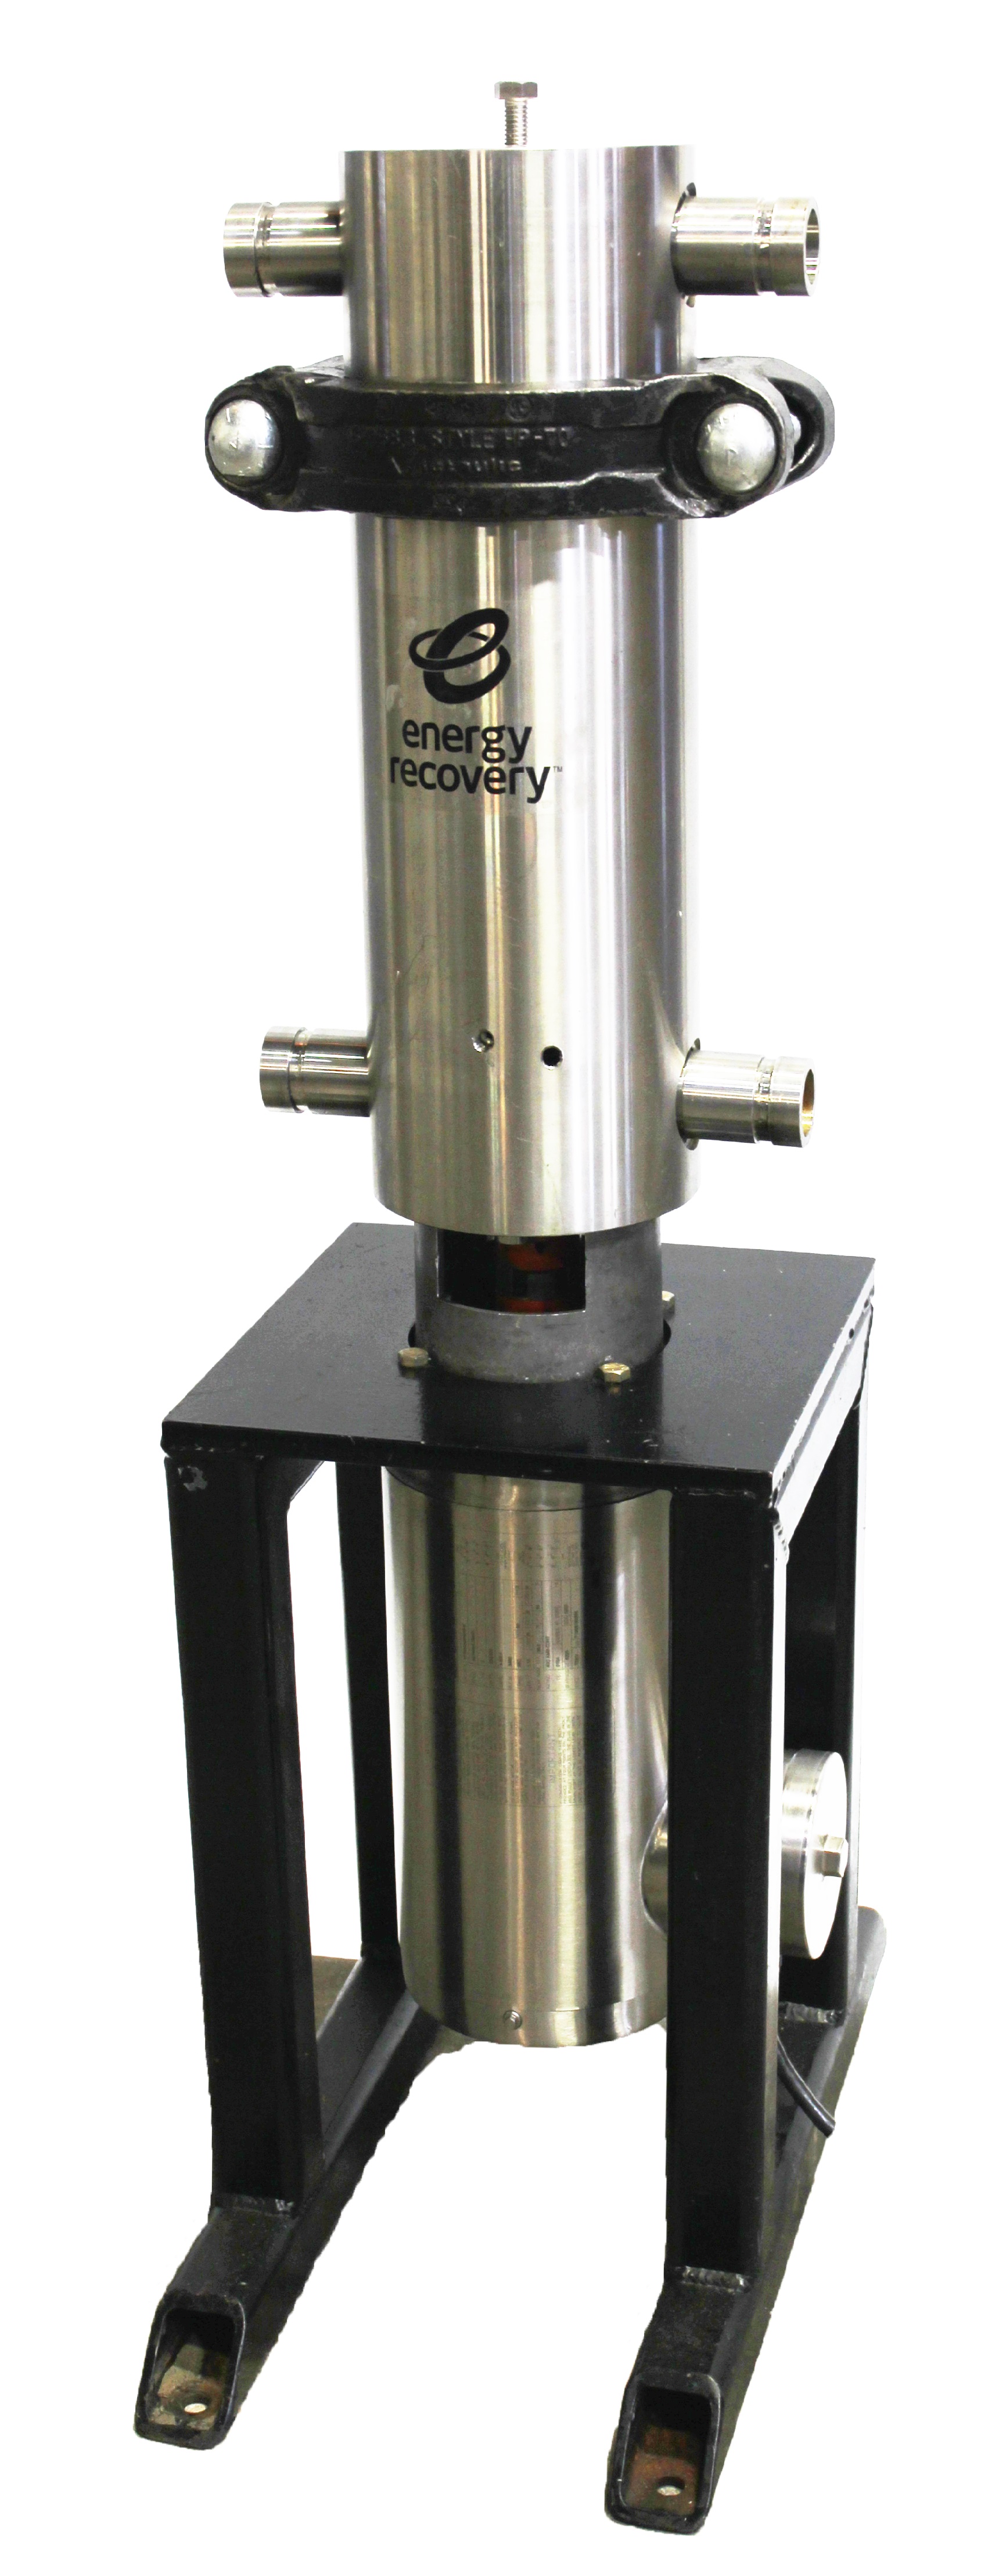
PX, high efficiency isobaric ERDs. Our PX is made of a ceramic rotor supported by a highly efficient hydrodynamic and hydrostatic bearing system. Products in this family are designed for use a variety of reverse osmosis (“RO”) processes within the water treatment industry, including SWRO and higher salinity within brackish water reverse osmosis desalination (“BWRO”), and as well as IWW. | |
| | | | | |
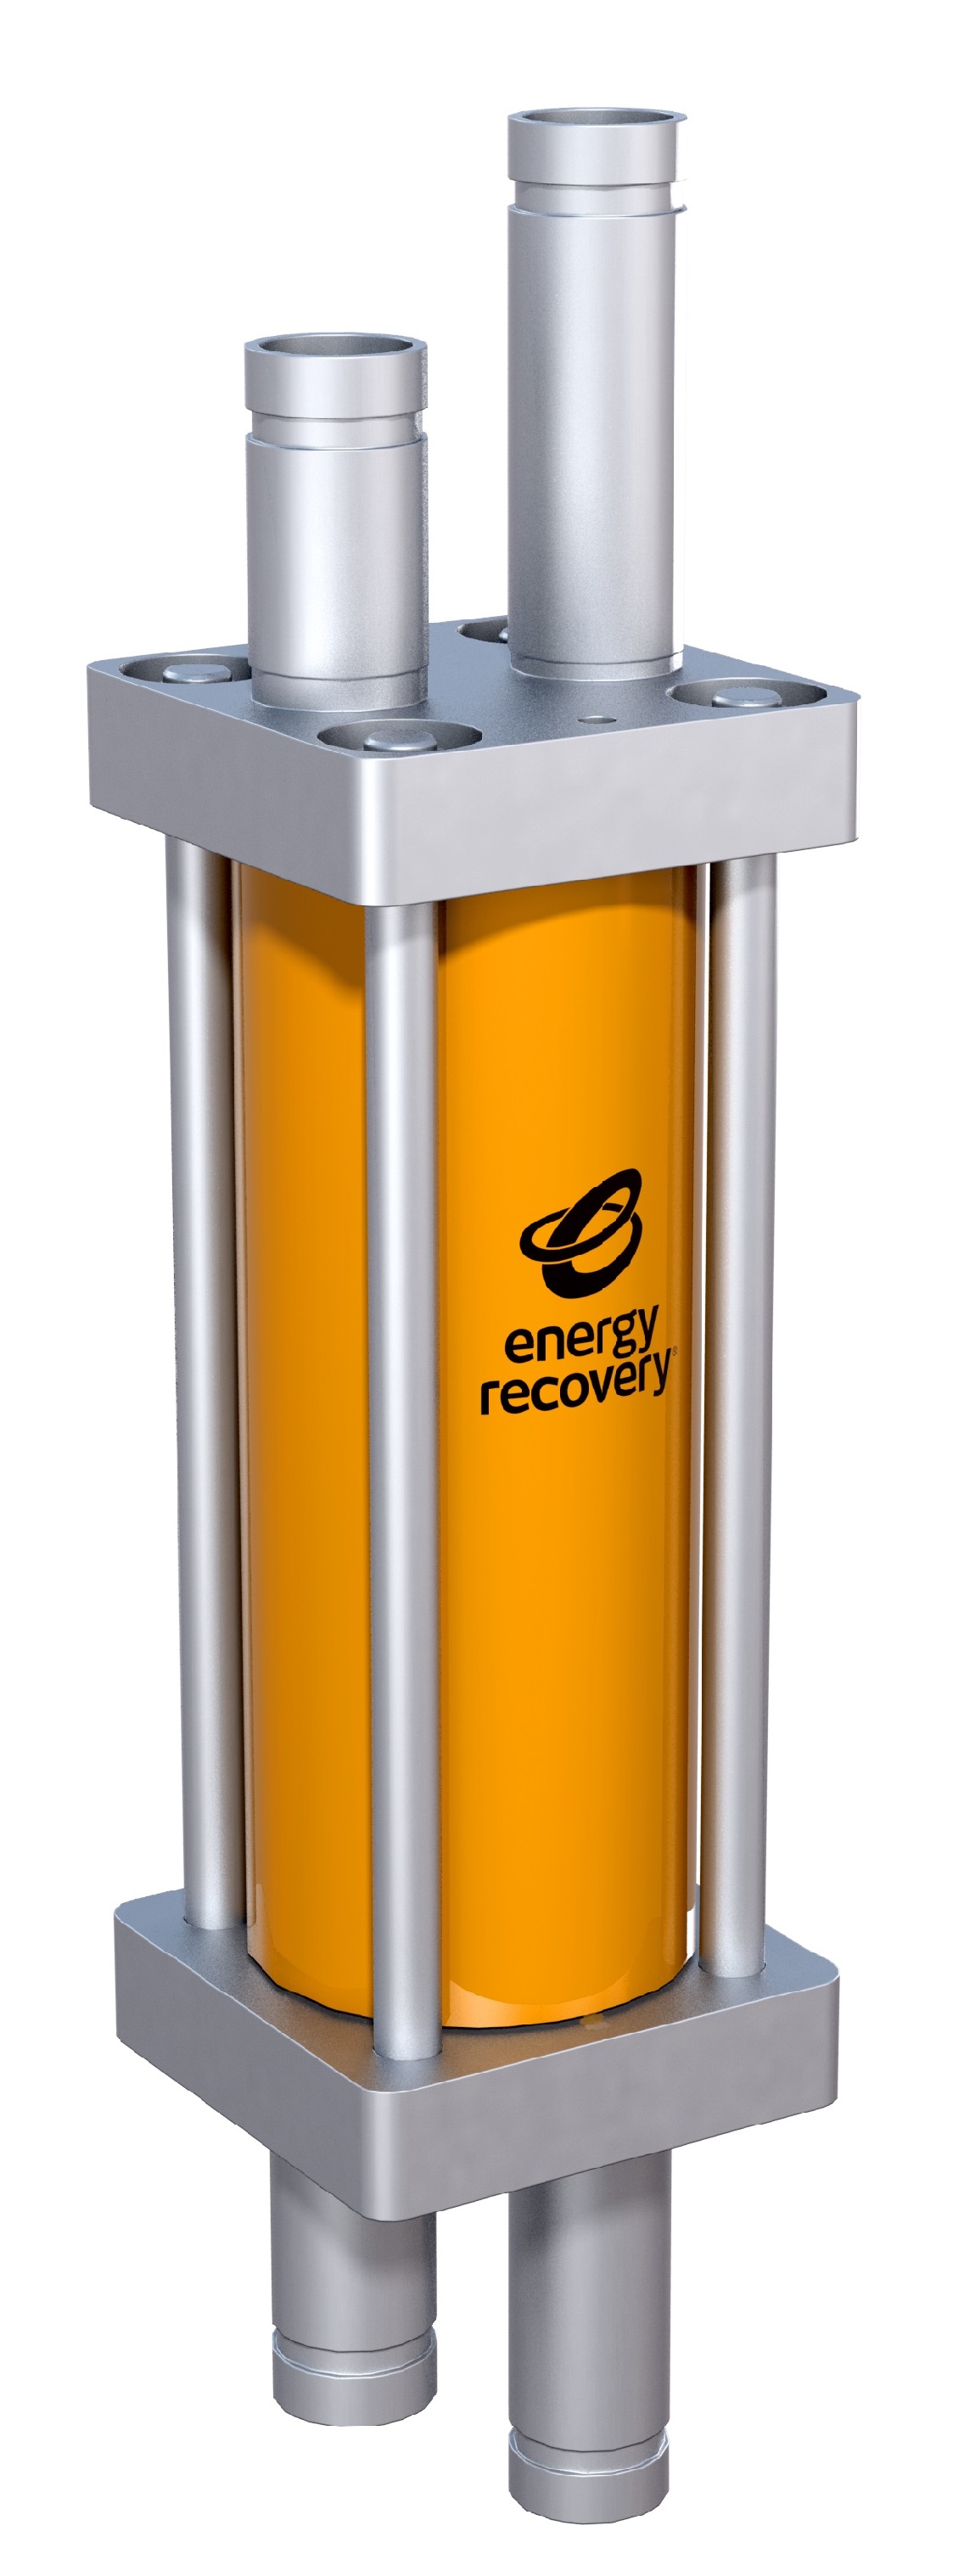
| Ultra PX™. In 2020, we introduced the Ultra PX ERD, which we believe addresses key challenges, such as energy intensity and environmental impacts, associated with treating industrial wastewater in a variety of RO applications. Designed with the pressure exchanger technology that powers our PX, the Ultra PX functions similarly to our PX but can withstand higher pressures and may recover up to 60 percent of wasted energy when applied to higher pressure RO processes, reducing energy use and operating costs. |
|
While RO adoption in industrial wastewater treatment is in its early stages, we believe our Ultra PX can help accelerate adoption of RO in the growing zero liquid discharge (“ZLD”) and minimal liquid discharge (“MLD”) market. Furthermore, we believe the Ultra PX can help make RO the preferred treatment option to achieve ZLD and MLD requirements by enhancing RO’s affordability and efficiency compared to thermal treatment options, similar to the impact of our PX in the seawater desalination market. |
| | | | | |
Turbochargers, high efficiency centrifugal ERD. Our AT and LPT Turbochargers are used in low-pressure brackish and high-pressure seawater desalination systems, as well as various other water treatment applications, such as those in IWW. Our Turbochargers product lines are highly efficient with state-of-the-art engineering in a compact configuration. We believe our Turbochargers deliver substantial savings, operational benefits, and ease of integration into systems. With custom-designed hydraulics that allow for optimum performance over a wide range of operating conditions, our turbocharger technology offers solutions to capital cost constrained single-stage RO applications, inter-stage boost applications typically found in brackish water desalination and some IWW systems, as well as in the processing of natural gas. | |
| | | | | |
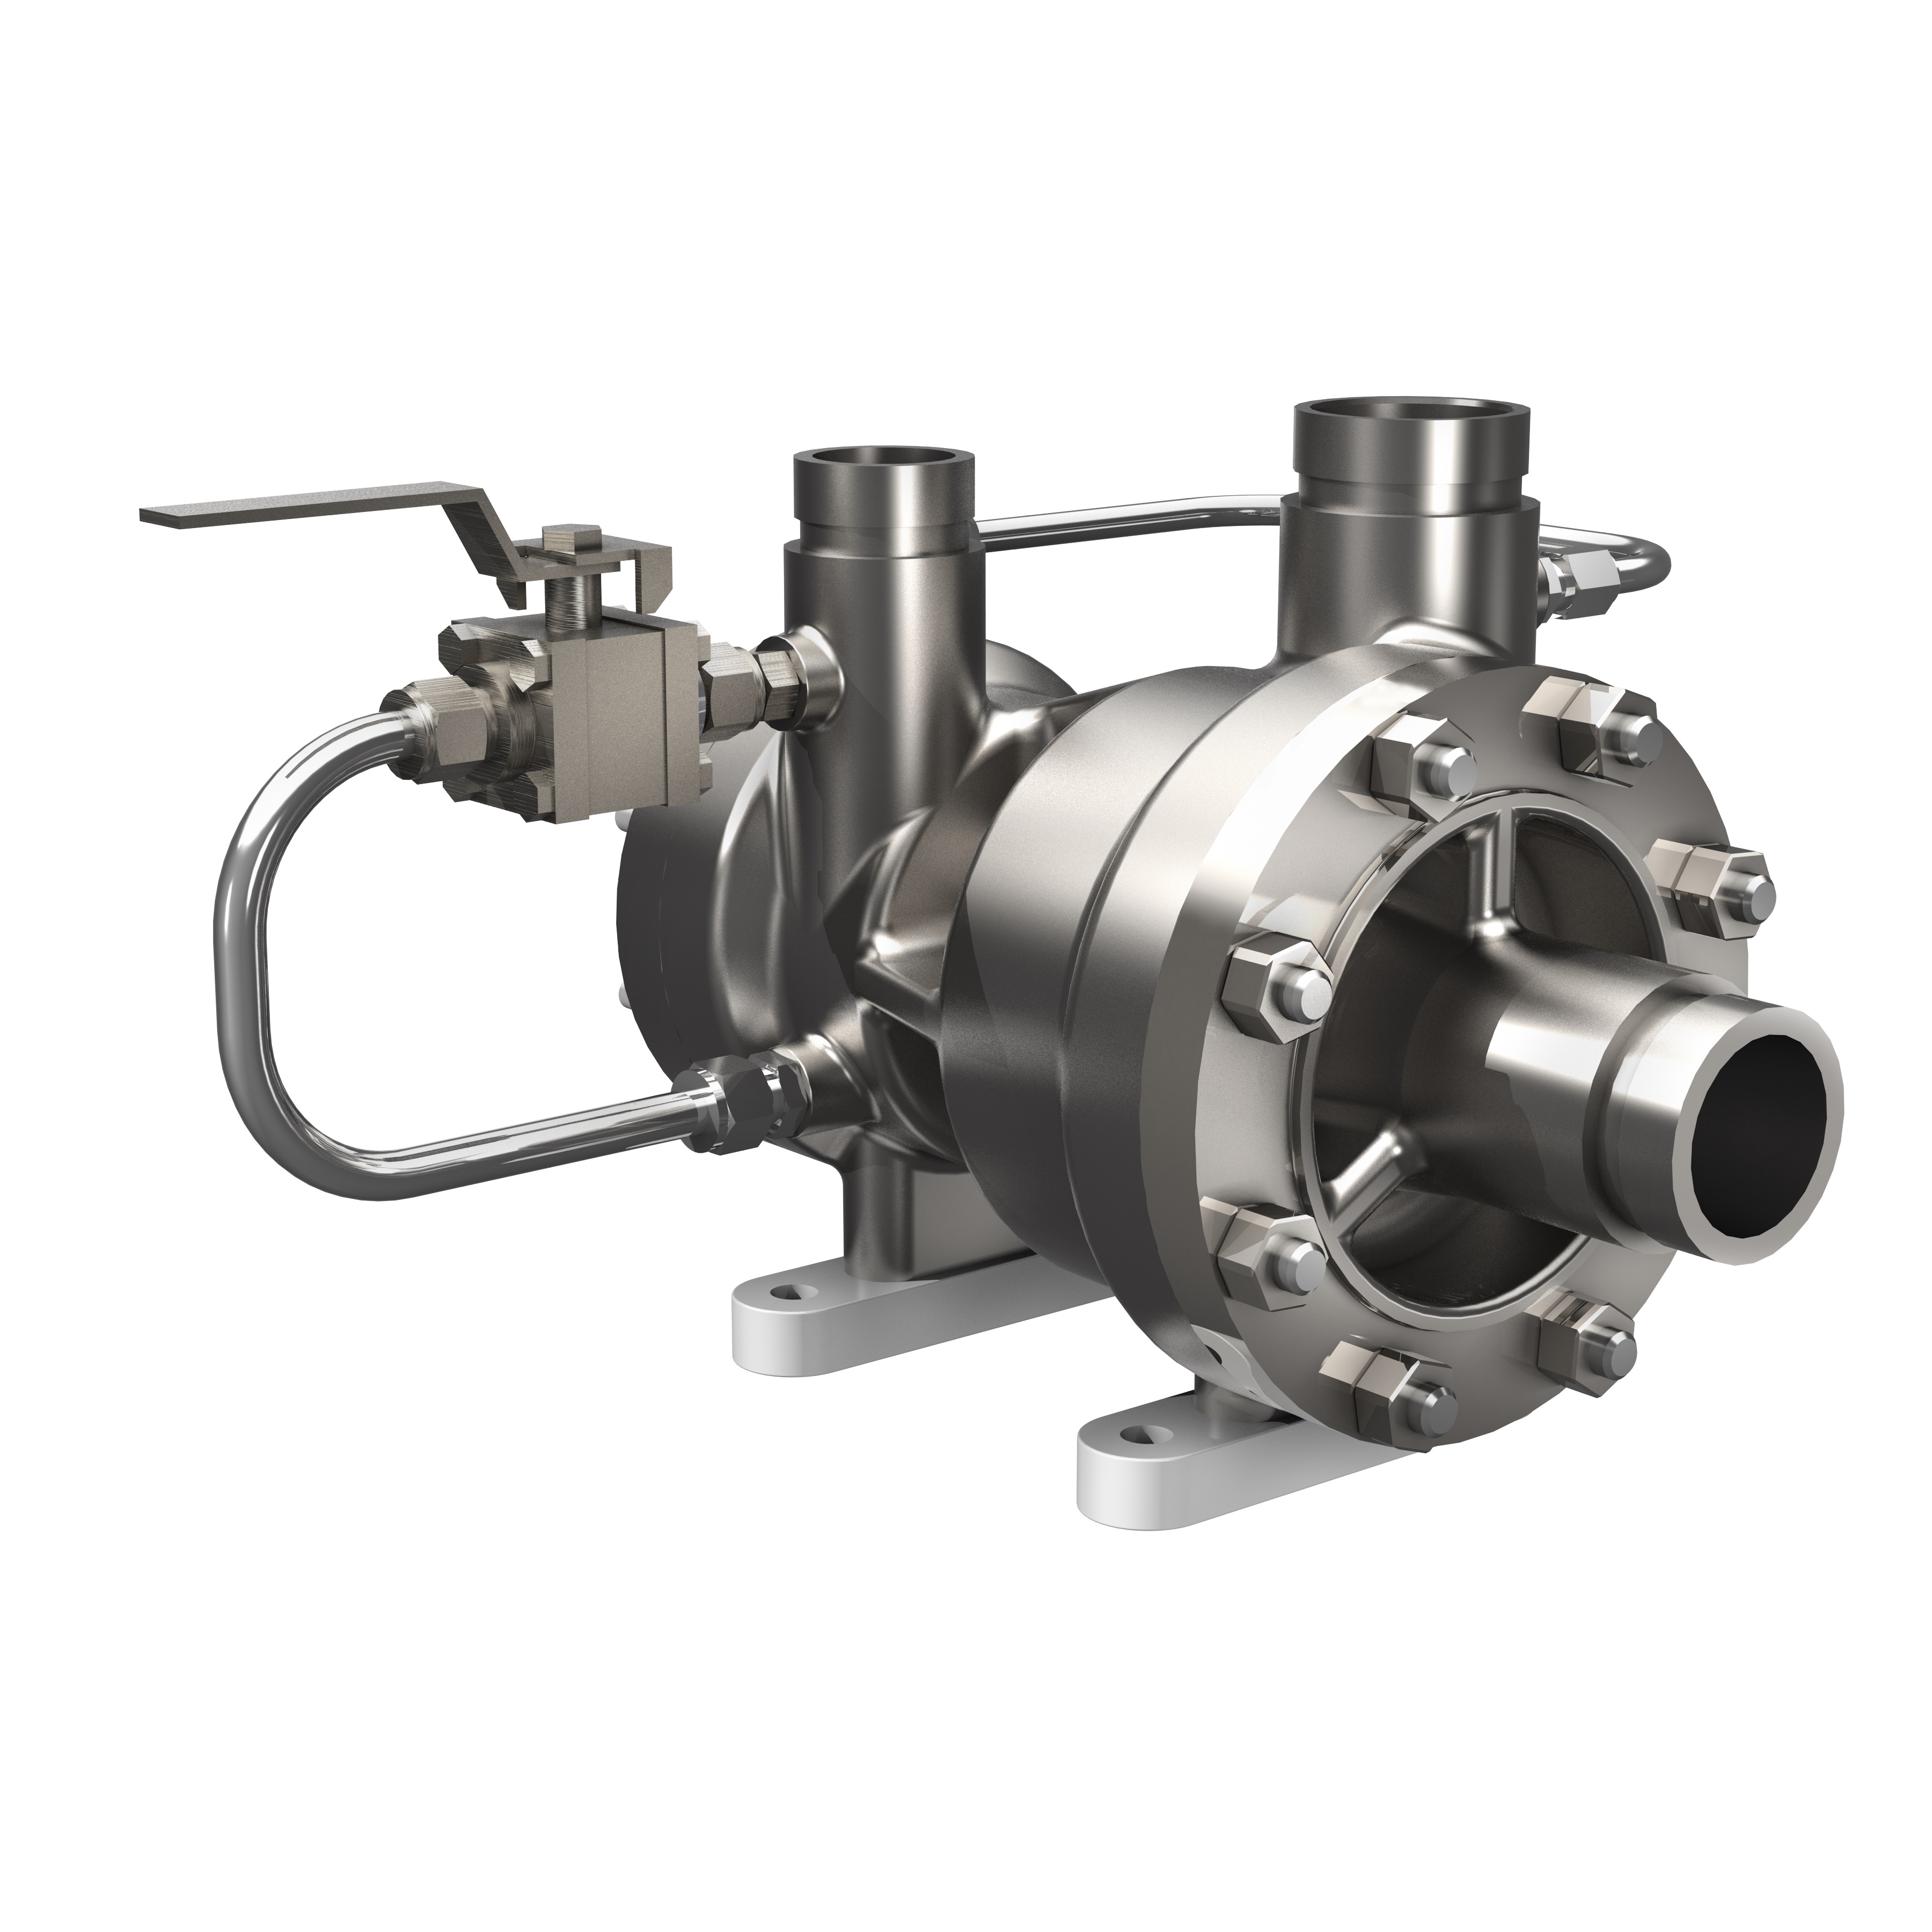
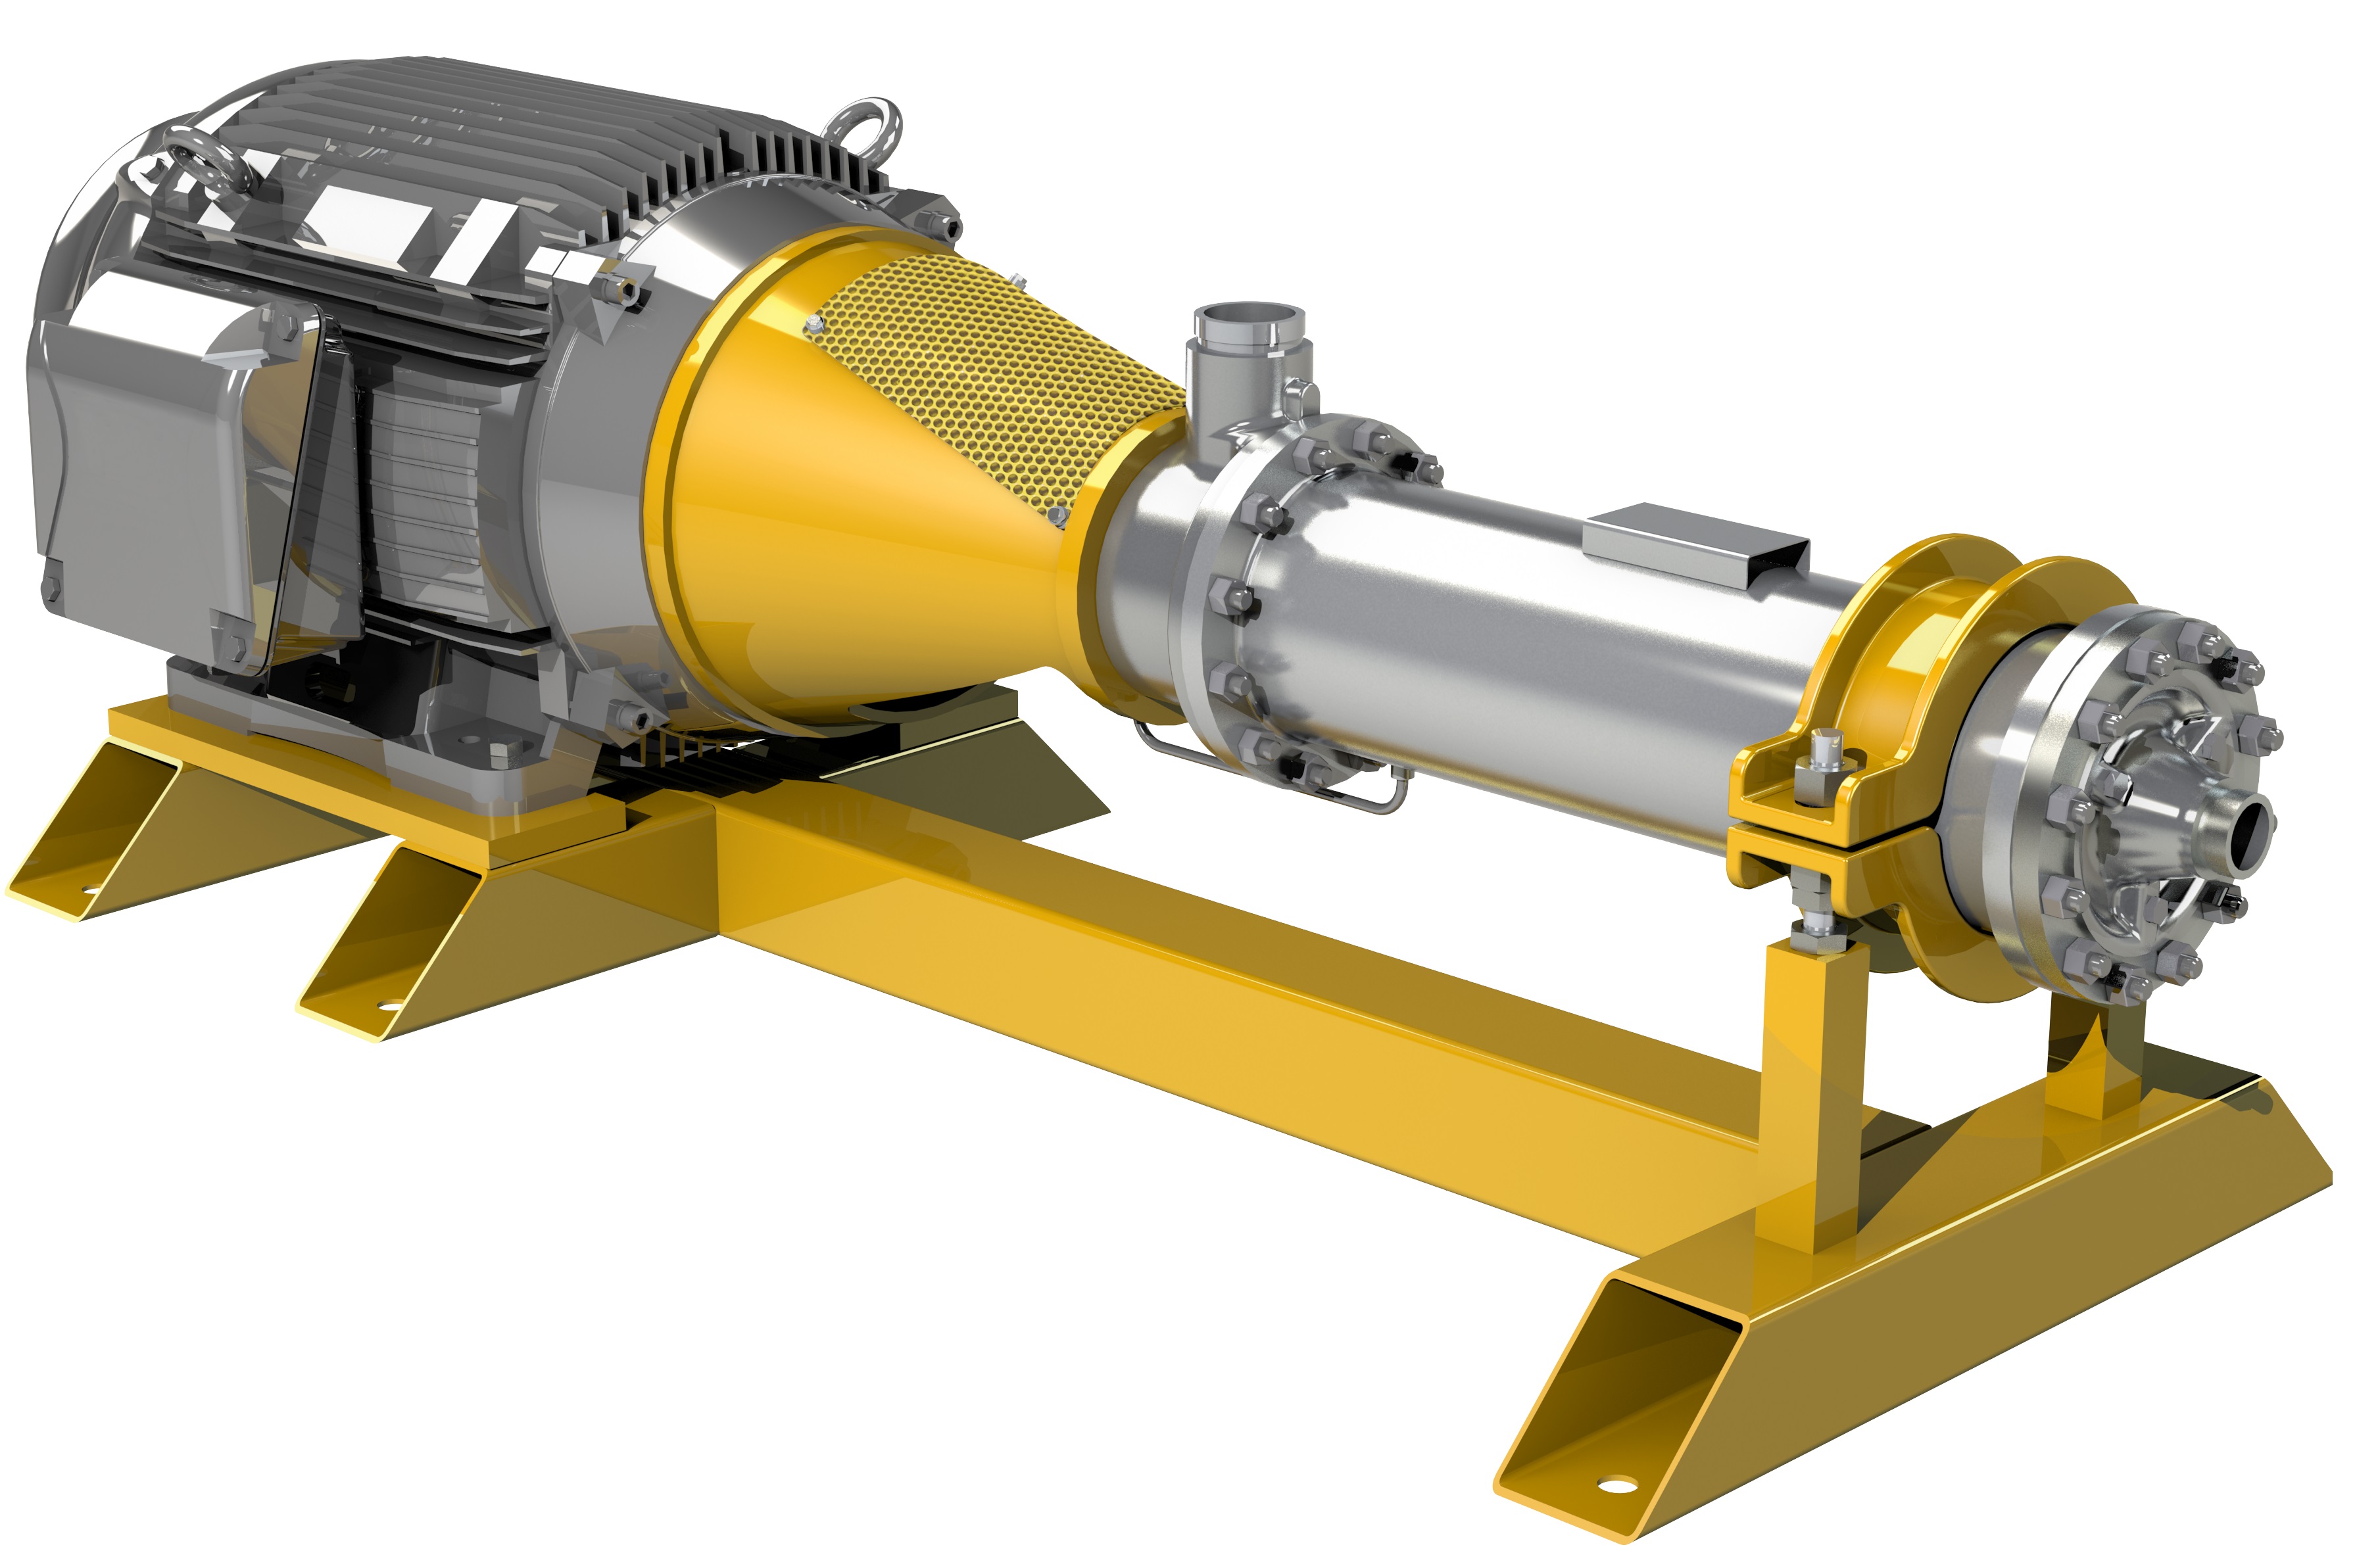
| Pumps. SWRO requires specialized high-pressure membrane feed and, in pressure exchanger applications, high-pressure circulation pumps. We manufacture and/or supply specialized high-pressure feed and circulation pumps for only a portion of the markets served by our ERD solutions. Our high-pressure feed pumps are designed to pressurize the membrane feed flow and overcome the osmotic pressure requirements of the feed water resulting in the production of desalinated water. Our high-pressure circulation pumps are designed to circulate and control the high-pressure flow through our PX and to compensate for small pressure losses across the membranes, PX and associated process piping. |
Energy Recovery, Inc. | 2021 Form 10-K Annual Report | 4
Water Treatment
The world’s need for clean water is intensifying, driven by population growth, industrialization, rapid urbanization, and climate change. According to the United Nations’ estimates, the world will only have 60% of the potable water it needs by 2030, and global demand will surge 30% by 2050, further outstripping supply. Apart from seasonal variations, the supply of fresh water generally remains fixed and is already decreasing in some geographic areas. These trends make the markets we serve, such as desalinating or filtering sea and brackish water, and the treatment and re-use of IWW, increasingly vital to quench global thirst.
Desalination
As reported in our 2020 ESG report, we estimated that in 2020, our life-to-date installed ERDs have saved water desalination customers approximately $2.6 billion in energy costs and helped our customers avoid over 26 terawatt-hours of energy usage, which represents approximately a 4% reduction in the global energy consumption for potable water utilities. Worldwide, SWRO plants using our ERDs produce over 24.0 million cubic meters of water per day (“m3/day”), enough to provide for more than 10% of the United States of America (the “U.S.”) population’s daily water needs. As water scarcity grows in communities across the globe, we are proud of our impact in enabling more affordable, sustainable access to this vital resource.
Reverse Osmosis. RO is the preferred technology in the vast majority of desalination applications, and growing in importance in IWW applications. As the industry leader in ERDs, we deliver efficient, scalable solutions for recovering otherwise wasted energy in the RO process, thereby allowing our customers to reduce their capital expenditures, as well as lower operating costs and reduce carbon emissions associated with the production of clean potable water. We also offer high-pressure multi- and single-stage centrifugal pumps designed to complement our ERDs for a wide range of RO plant capacities and applications.
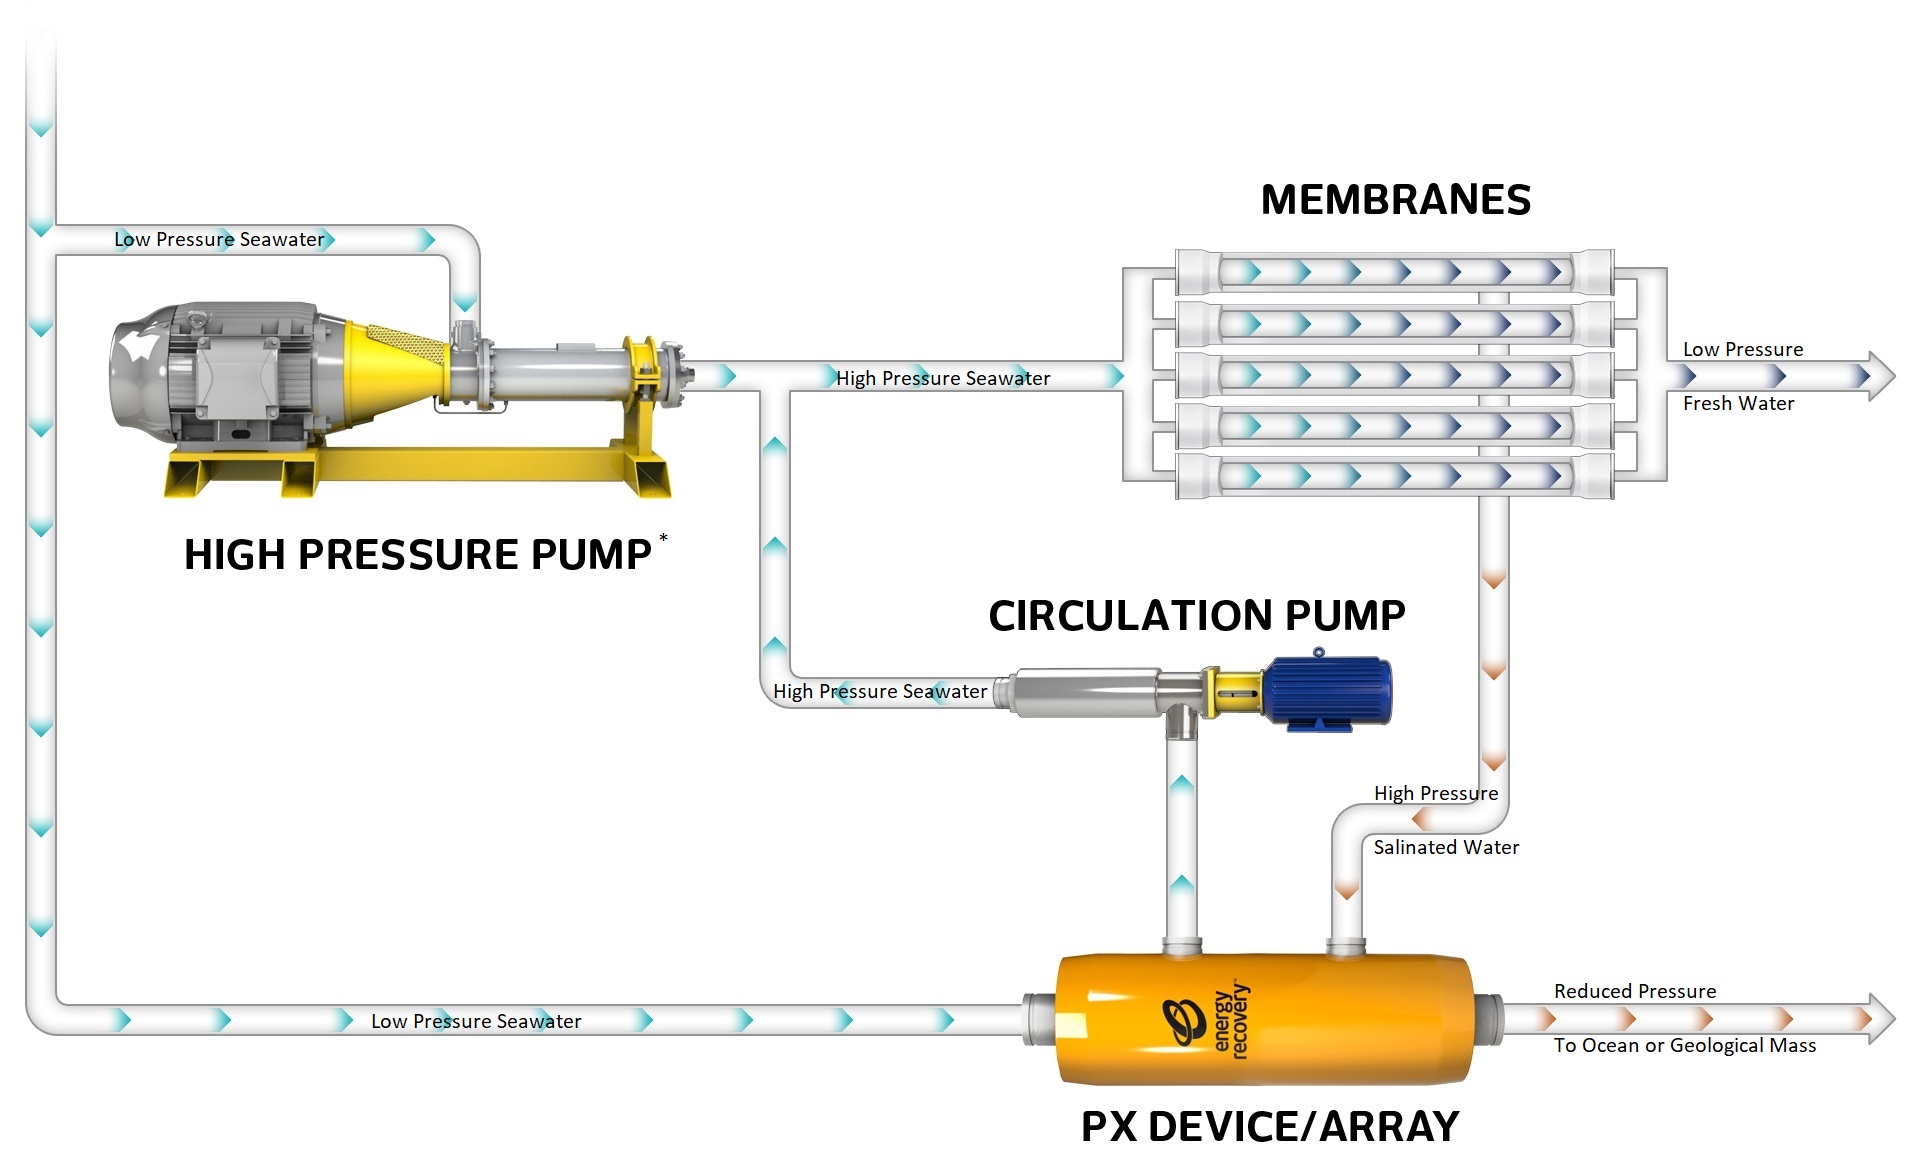
Desalination and Industrial Wastewater Process Flow
* Incoming seawater is simultaneously routed to a high-pressure pump and the PX, allowing the customer to reduce the main high pressure pump size by 60%. Desalination and industrial wastewater process flow diagram incorporating our PX is for illustration purposes only. Actual configuration may vary.
Energy Recovery, Inc. | 2021 Form 10-K Annual Report | 5
Seawater Reverse Osmosis Desalination. Energy intensive pumps are used to pressurize feed waters with varying concentrations of salts, minerals and contaminants, which is then forced through a semi-permeable membrane to achieve the desired water quantity and quality. The SWRO process results in fresh water, suitable for potable, agricultural and industrial use and a highly concentrated and pressurized concentrate or brine stream. Rather than dissipating or “wasting” the pressure energy from the discharge brine, our PX, the most widely used energy recovery solution, can transfer the pressure energy from the high-pressure discharge stream directly to a portion of the low-pressure filtered feed water, thereby reducing the amount of flow required by the main high-pressure processes’ pumps. Our highly efficient technology can recycle this pressure energy at efficiencies up to 98%. This results in a more efficient process as the size of the high-pressure pumps are greatly reduced, no longer need to be sized for full membrane feed flow, and are now re-sized for the permeate flow, thus reducing the energy usage by up to 60%. As a result, our PXs have helped make SWRO an economically viable and more sustainable option in the production of potable water.
Brackish Water Reverse Osmosis Desalination. The BWRO process is similar to the SWRO process. Brackish water typically has lower salt, mineral and contaminant content than seawater, therefore, fewer solids need to be removed and less energy is expended on pressurizing the feed water. Due to the lower cost and available pressure energy involved, our Turbochargers generally have characteristics more applicable to the BWRO process. The amount of salts in the feed water will ultimately determine the system design and operating conditions which, in turn, will drive decisions related to the specification or type of ERD to be employed, if any.
SWRO and BWRO have been our primary markets for revenue generation. The market ranges from small, decentralized desalination plants, such as those used in cruise ships and resorts, to large-scale (“mega”) project desalination plants, defined as those which produce over 50.0 thousand m3/day. Because of the geographical location of many significant water desalination projects, geopolitical and economic events can influence the timing of expected projects. We anticipate that markets traditionally not associated with desalination, such as the U.S. and China, will inevitably develop and provide further revenue growth opportunities.
Both the SWRO and BWRO markets are represented by newly constructed water treatment plant (“greenfield”) projects, and existing water treatment plant (“brownfield”) projects, such as retrofits, upgrades and plant expansions, that utilize legacy ERD technologies, alternative technologies or no ERDs at all. The greenfield market has been the key market for our water business and represents large scale projects that are typically public in nature and involve a formal tendering process; while smaller projects, which are not as common and which may be private in nature, may or may not involve a formal tendering process. Typical brownfield facilities face higher energy consumption and reduced plant availability due to legacy technologies and include improvements to existing operations, equipment upgrades and potential expansions of existing capacity.
We work directly with the project bidders, generally large engineering, procurement and construction firms (“EPC”), end-users and industry consultants, to specify our products prior to the project being awarded, where possible. Once the project is awarded to an EPC, our normal sales process ensues. The greenfield market is highly competitive, and the tendering process pays close attention to the cost to desalinate water (i.e., dollars per cubic meter of water produced). Retrofit opportunities may or may not have a formal tendering process. We typically approach the plant operators, owners and/or end-users of these facilities to present our leading life-cycle cost value-proposition
Industrial Wastewater
The IWW market covers a wide range of industries and geographies. As governments across the globe increase their focus on water conservation, reuse and limiting the amount of pollution, they are establishing more stringent requirements for wastewater treatment and discharge. China and India are two countries that have begun to mandate ZLD or MLD requirements for specific industries, and we expect this trend to expand throughout the world in response to the growing gap between water availability and water demand while focusing on decreasing and/or eliminating pollution from heavy industries.
Many companies are also under pressure from investors and other stakeholders to adopt more sustainable water reuse practices and to reduce their reliance on existing water resources. Sectors such as automotive and electric vehicles, chemicals, pulp and paper, textiles, semiconductors, and other heavy industries are often large polluters and/or water consumers. Their water usage can compete with municipal and agricultural water resources, further straining potable water supply in areas already struggling with water scarcity.
Energy Recovery, Inc. | 2021 Form 10-K Annual Report | 6
A variety of RO technologies may be utilized in the IWW filtration process where our energy recovery solutions may be utilized. Such processes are typically multi-staged, with each stage increasing in pressure as the wastewater is filtered until it reaches a desired stage of purity. Our ERDs can be applied to each of these stages, including our Turbochargers at lower pressures, our flagship desalination PX, and our Ultra PX at the highest pressures, to recover clean water from a wastewater stream and concentrate pollutants to a level where they can be economically utilized or safely disposed, rather than discharged into waterways. Typical operating pressures can range from a few hundred psi to 1,800 psi. We have a full suite of products to serve the various process stages in IWW treatment. Some IWW treatment plants seek to concentrate the dissolved pollutants to an extent that they produce very little or no discharge of pollutants. These treatment facilities are often associated with the mineral extraction, mining, textile, pulp and paper, power generation, and chemical manufacturing industries.
Technology Conversion
The thermal desalination process was the dominant seawater desalination technology employed throughout the 1990’s. In this process, thermal energy is used to evaporate water from heated seawater and subsequently condenses the vapor to produce pure water. Starting in the early 1990’s, due to many factors including the introduction and greater usage of ERDs, the process of choice for the desalination industry shifted from thermal- to membrane-based RO desalination.
Over the past two decades RO desalination technology has become the predominant technology, supplanting thermal desalination technology as today’s desalination technology of choice. As water desalination plants that use the thermal desalination technology age, the industry expects the majority of these plant owners to replace their existing thermal technology with RO desalination technology. These conversions are driving new demand for RO desalination process equipment, which creates demand for our products.
We also see a similar technology conversion in the IWW market. Thermal technologies have been the technology of choice for RO systems seeking to maximize the removal of water in the process, such as in ZLD and MLD processes. Similar to seawater desalination, thermal technologies are an energy- and cost-intensive method for cleaning water in traditional ZLD and MLD configurations, with up to fifty percent of costs typically stemming from thermal treatments. Even in treatment facilities that adopt RO, ZLD and MLD will still require a small amount of thermal treatment to achieve ZLD and MLD objectives. However, leveraging the Ultra PX with RO will significantly lower thermal demand, saving energy and reducing emissions.
Project Channels
We separate our sales into three distinct channels due to financial and other commercial and technical aspects of the projects. We identify these sales channels as megaproject (“MPD”), original equipment manufacturers (“OEM”) and aftermarket (“AM”).
Megaproject. MPD customers are major firms that develop, design, build, own and/or operate large-scale desalination plants with capacities greater than 50.0 thousand m3/day. A majority of our water treatment revenue comes from these customers. Our MPD customers have the required desalination expertise to engineer, undertake procurement for, construct, and sometimes own and operate, large-scale desalination plants or megaprojects. Due to the project structures and capacities of these megaprojects, ongoing operating costs and life cycle costs, rather than the initial capital expenditures is the key factor in the MPD customers’ selection of an ERD solution. As such, MPD customers most often select our PX, which we believe offers market-leading value with the highest technological and economic benefit. We work with our MPD customers to specify and optimize our PX solutions for their plant designs. The average time between project tender and shipment ranges from 16 to 36 months, or more. Each megaproject represents revenue opportunities ranging from approximately $1 million to $21 million. We estimate that the total capital investments by MPD customers in these large-scale infrastructure projects may range between $50 million to over $1 billion.
Original Equipment Manufacturer. OEM customers are companies that supply equipment, packaged systems, and various operating and maintenance solutions for small to medium-sized desalination plants, utilized by commercial and industrial entities, as well as national, state and local municipalities worldwide. We sell to our OEM customers a broad set of our products, including our PX, Turbochargers, high-pressure pumps and circulation “booster” pumps, and associated services. OEM projects comprise desalination plants processing up to 50.0 thousand m3/day, such as desalination plants located in local municipalities, hotels and resorts, power plants, cruise ships, and agricultural sectors, among others. In addition, these OEM customers purchase our solutions for mobile, decentralized “quick water” or emergency water solutions. Unlike megaprojects, OEM projects are smaller in scope and, as such, the initial capital expenditure, rather than future ongoing operating costs, is often more of a factor in selection of an ERD solution. Accordingly, we sell not only our PX, but also our Turbochargers, which offer a lower cost alternative to our PX. The typical OEM project timeline from project tender to shipment ranges from one to 16 months. Each OEM project typically represents revenue opportunities up to $1 million. We estimate that the total capital investments by OEM customers in these projects are typically up to $50 million.
Energy Recovery, Inc. | 2021 Form 10-K Annual Report | 7
Aftermarket. AM customers are desalination plant owners and/or operators who can utilize our technology to upgrade or keep their plant running, and usually have our solutions installed and in operation. We provide spare parts and repair services, field services and various commissioning activities. We leverage our industry expertise in supporting our existing installed base to ensure that our ERD solutions are being operated effectively and efficiently in order to maximize plant availability and overall profitability of the facility operations, as required by our industry partners and customers.
Sales and Marketing
Our strategically located direct sales force offers our products through capital sale to our customers around the world. We maintain a sales and service footprint in strategic territories, allowing rapid response to our customers’ needs, such as in the U.S., China, India, Latin America, Spain, Saudi Arabia and the United Arab Emirates. Our team is comprised of individuals with many years of desalination and water treatment industry expertise. Aligning to the geographic breadth of our current and potential future customers, our product marketing approach includes a strategic presence at water industry events across various regions. In addition, we leverage our industry and market intelligence to develop new solutions and services that can be adopted by our growing customer base.
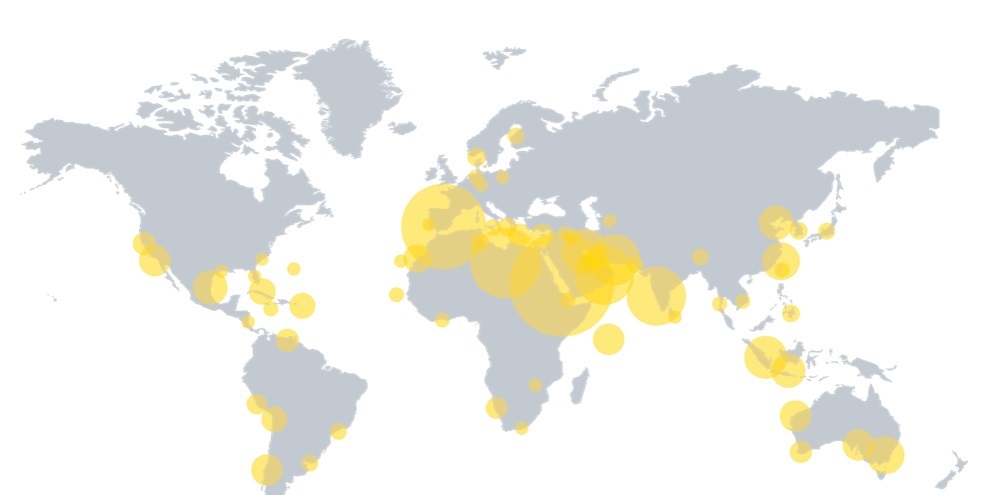
Global Installations of Energy Recovery’s ERDs
A significant portion of our revenue is from outside of the U.S. Additional segment and geographical information regarding our product revenue is included in Note 2, “Revenue,” Note 11, “Segment Reporting,” and Note 12, “Concentrations,” of the Notes to Consolidated Financial Statements in Part II, Item 8, “Financial Statements and Supplementary Data,” of this Annual Report on Form 10-K (the “Notes”).
Energy Recovery, Inc. | 2021 Form 10-K Annual Report | 8
Competition
The market for ERDs, high-pressure pumps, and circulation “booster” pumps, is competitive. As the demand for fresh water increases and the market expands, we expect competition to persist and intensify. We have three main competitors for our ERDs: Flowserve Corporation (“Flowserve”); Fluid Equipment Development Company (“FEDCO”); and Danfoss Group (“Danfoss”). We believe our solutions offer a competitive advantage compared to our competitors’ solutions because our ERDs provide the lowest life-cycle cost and are, therefore, the most cost-effective ERD solutions for the RO desalination application.
In the market for large megaprojects, our PX competes primarily with Flowserve’s DWEER product. We believe our PX has a competitive advantage, as compared to the DWEER product, because our devices are made with highly durable and corrosion-resistant aluminum oxide (“alumina”) ceramic parts that are designed for a life of more than 25 years, are warrantied for high efficiencies, and cause minimal unplanned downtime, resulting in lower lifecycle costs. Additionally, our PX offers optimum scalability with a quick startup, as well as no scheduled maintenance.
In the market for small- to medium-sized desalination plants, as well as IWW, our ERD solutions compete with FEDCO’s turbochargers and Danfoss’ iSave. We believe that our PX has a distinct competitive advantage over these solutions because our devices provide significantly higher energy savings, have lower lifecycle maintenance costs, and are made of highly durable and corrosion-resistant alumina ceramic parts. We also believe that our Turbochargers compete favorably with FEDCO’s turbochargers based on efficiency, price, and because our Turbochargers have design advantages that enhance efficiency, operational flexibility and serviceability.
In the applicable market and flow ranges that we serve for high-pressure pumps and circulation pumps, our solutions compete with pumps manufactured by FEDCO, Flowserve, KSB Aktiengesellschaft, Torishima Pump Mfg. Co., Ltd., Sulzer Pumps, Ltd., and other companies. We believe that our pump solutions are competitive with these solutions because our pumps are developed specifically for RO desalination, are highly efficient, feature product-lubricated bearings, and are often purchased with our ERDs in small- to medium-sized plants.
Seasonality
There is no specific seasonality to highlight that occurs throughout a calendar year. We often experience substantial fluctuations in product revenue from quarter-to-quarter and from year-to-year primarily due to the timing and execution of our MPD shipments, which vary from year to year.
Emerging Technologies
Today, we are leveraging our pressure exchanger technology platform to develop novel new product applications and diversify into new industries. We continue to push the limits of what our core pressure exchanger technology can do, which we believe will unlock new commercial opportunities in the future.
Refrigeration
The global refrigeration industry is a leading contributor to greenhouse gas emissions and HFC refrigerants are the leading contributor. This industry is the fastest growing source of greenhouse gas emissions, growing at a rate of approximately 10% to 15%. Worldwide, more than 120 countries have signed on to the Kigali Amendment which establishes a timeline for the mandated phase down of HFC in both developed and developing countries. In May 2021, the U.S. Environmental Protection Agency (the “EPA”) announced its intention to phase down the production and import of HFC emissions by 85% by 2036, in accordance with the Kigali Amendment. In addition, certain states in the U.S., such as the states of California and Washington, are also adding regulations requiring supermarkets to change their refrigeration systems and the European Union is similarly moving to limit HFCs with supplemental regulations such as the F-Gas phase down.
All of these regulations are driving the refrigeration industry, as well as several supermarket chains looking for a safer source of refrigerants, to shift to CO2, which is one of the most sustainable and safe natural refrigerants due to its low toxicity and flammability, as compared to alternative refrigerants, such as ammonia and propane. As the markets catch up to comply, we anticipate the sales of CO2 refrigeration systems to increase.
Energy Recovery, Inc. | 2021 Form 10-K Annual Report | 9
| | | | | |
The challenge today is to make CO2 systems less costly and more efficient in order to bolster the economic case for transitioning to environmentally-friendly CO2 refrigeration, especially in warmer climates where energy consumption in a CO2 refrigeration system is much higher compared to a HFC system. We believe our pressure exchanger technology can solve this challenge by reducing energy consumption and lowering the costs of CO2 systems, similar to what we have achieved in desalination and IWW applications. Our refrigeration-focused product, the PX G1300 (“PX G”), leverages our existing ceramics, material science, and manufacturing expertise, and could eventually alter the standard refrigeration system architecture by reducing costs for retail end users such as grocery stores. The PX G reduces the energy consumption and operating costs of CO2 refrigeration systems in a broad range of operating conditions. We see this as a significant accelerator for adoption of CO2 refrigeration and announced our first commercial contract in the fourth quarter of fiscal year 2021. | |
The commercial refrigeration market ecosystem has multiple players who integrate the components to build a system. These multiple players include supermarkets, which are the end users of the systems; contractors that assist with the installation and maintenance of the systems; refrigeration system manufacturers; and design consultants that assist in designing and specifying the systems for the supermarkets and the component specifications to the OEMs.
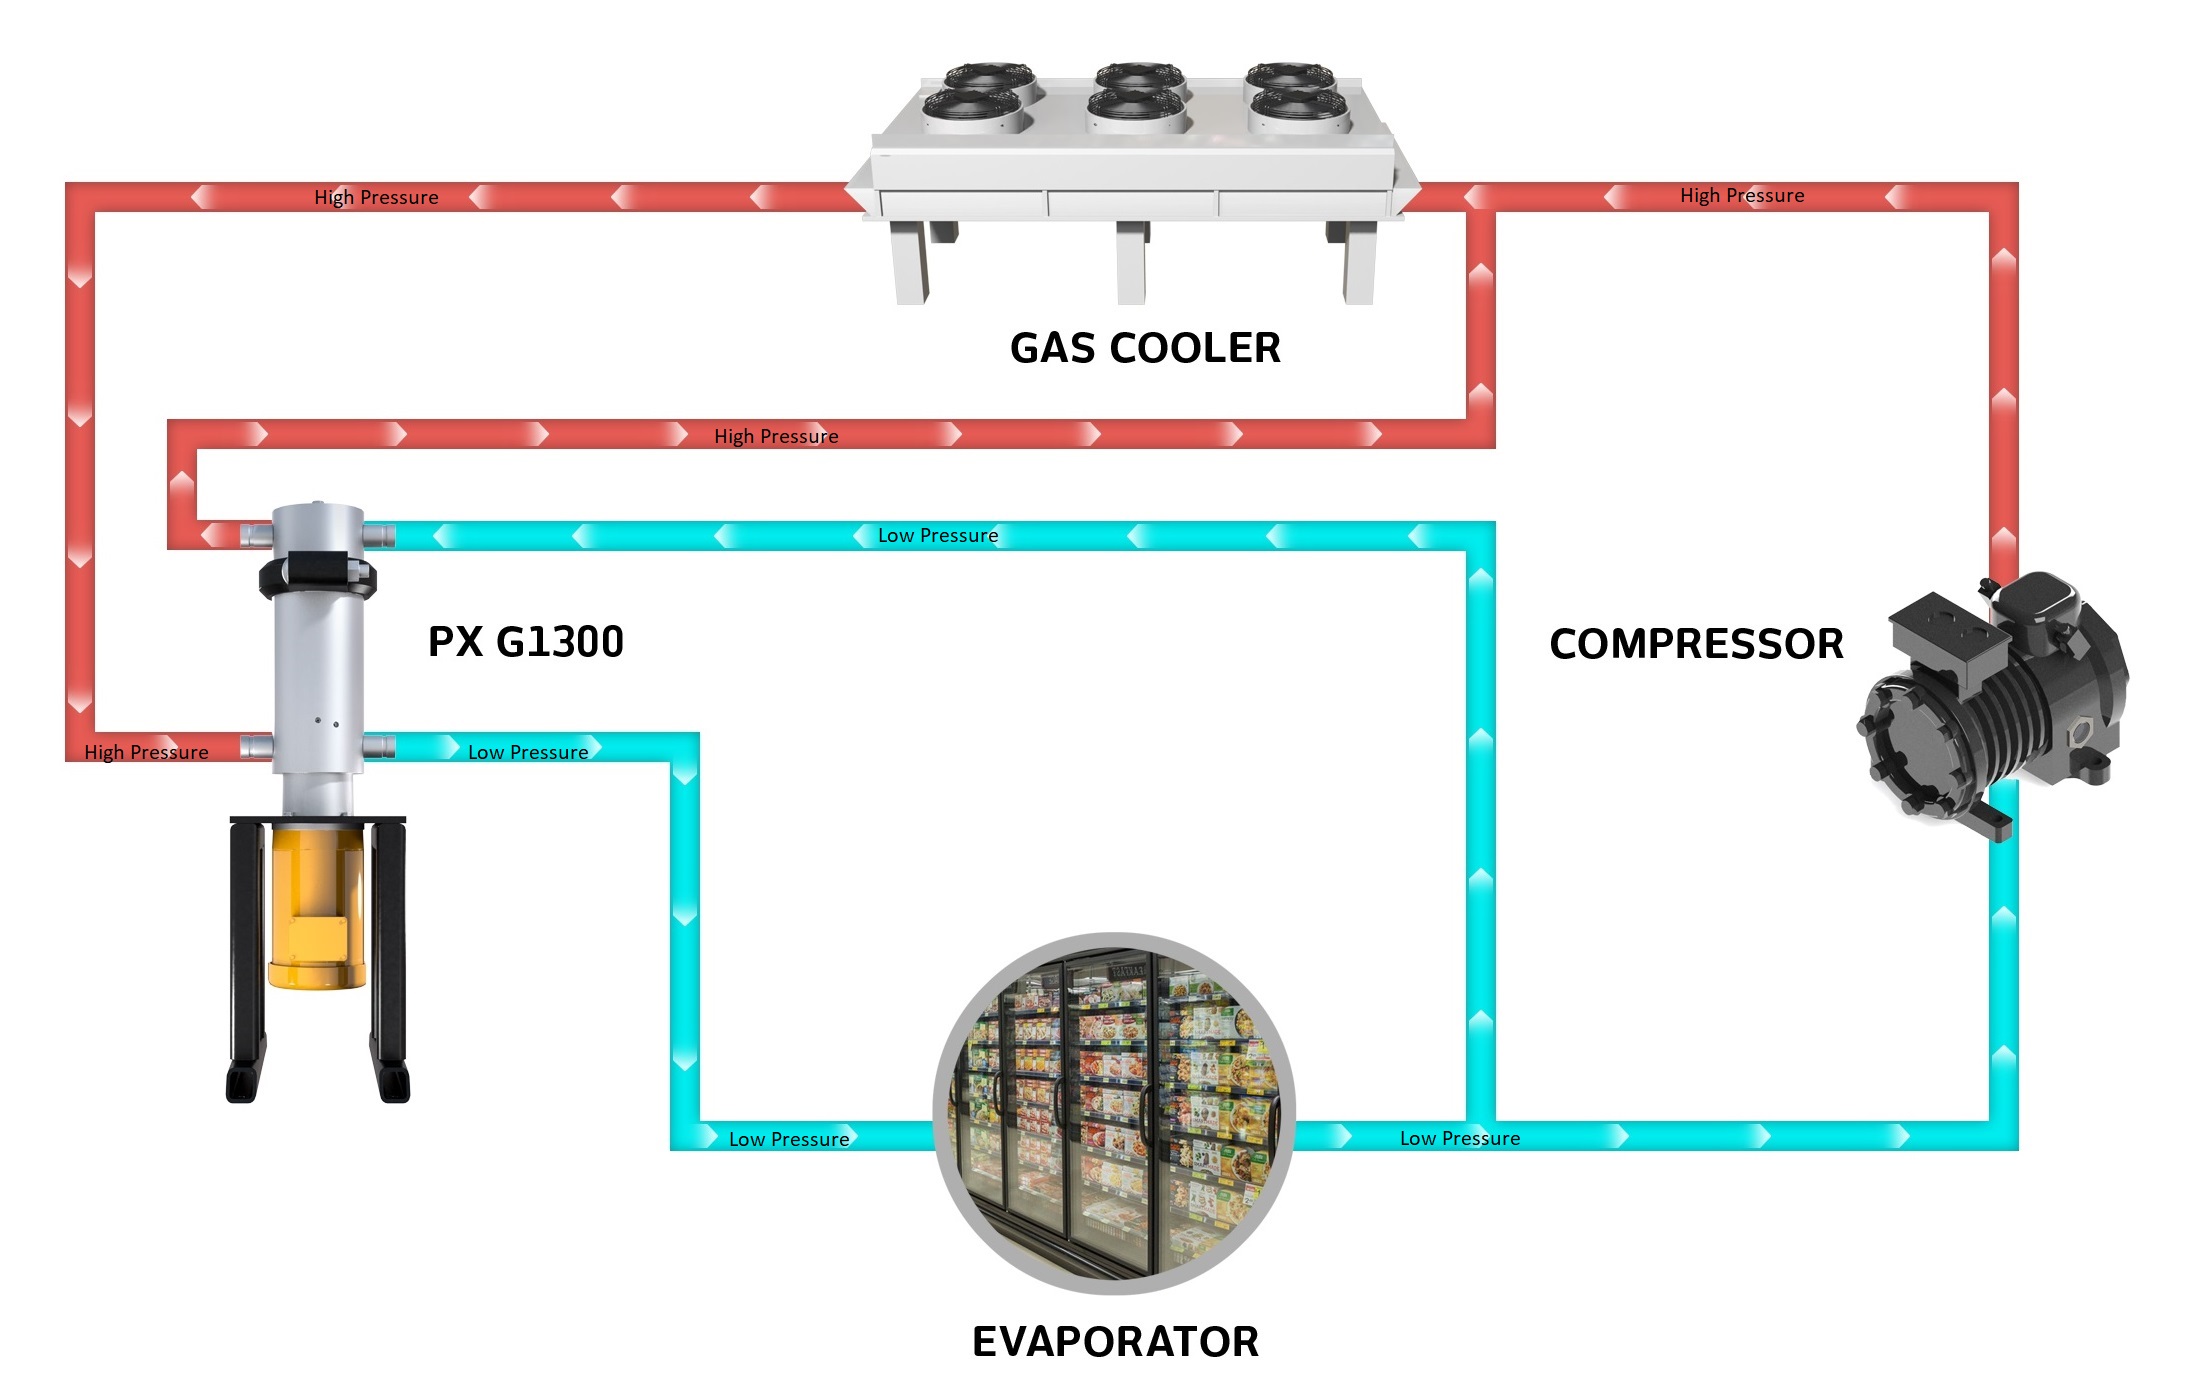
Refrigeration System Gas Process Flow Incorporating Our PX G1300
* Low pressure CO2 is simultaneously routed to a compressor and the PX G1300 which allows the customer to reduce the compressor size. Refrigeration system gas process flow diagram incorporating our PX G1300 is for illustration purposes only. Actual configuration may vary.
Energy Recovery, Inc. | 2021 Form 10-K Annual Report | 10
Natural Gas Processing
| | | | | |
| Combustion of natural gas emits about half as much CO2 as coal and 30 percent less than oil, as well as far fewer pollutants, per unit of energy delivered. Natural gas is typically processed by removing acid gases, such as CO2 and hydrogen sulfide before it is ready for distribution and use. A common acid gas removal process uses an amine solvent to absorb acid gases in a high-pressure contactor column. Having absorbed the CO2 and hydrogen sulfide, the pressurized (rich) amine is then depressurized and processed into regenerated (lean) amine for reuse. Our technology has enabled gas processing plant owners and operators, our targeted customers, to achieve immediate and long-term energy savings with little or no operational disruption. Our IsoBoost™ product, an ERD solution based on our turbocharger technology, can recover the energy wasted during the depressurization of the amine. This recovery of amine pressure energy allows the use of fewer high-pressure pumps which reduces energy consumption and thereby the carbon footprint of the plant, capital expenditures, and energy and maintenance costs. In addition, reduced downtime and maintenance can positively impact plant availability. Within the gas processing, the IsoBoost technology enables the recovery of pressure energy in the fluid flows either through the exchange of pressure within the application or by converting it to electricity. |
Several companies manufacture hydraulic turbochargers, which could eventually develop into competitive technology to our IsoBoost. However, none of the companies that currently manufacture turbochargers have significant experience within gas processing. In order to utilize a turbocharger in gas processing, expertise is required to validate the component as well as system level design and integration within a gas processing application.
Manufacturing
Our products, including our PX, Turbochargers, high-pressure pumps, and circulation “booster” pumps, are designed, produced, assembled and tested in our facilities located in California. Our facilities include advanced ceramics manufacturing and testing laboratories, multiple hydraulic performance testing loops, computer numerical control (also referred to as “CNC”) machines, assembly stations and warehouse.
Alumina ceramic components for our PX are manufactured in-house from high-purity alumina to the final product. As part of our waste management strategies, during the machining phase, when the solid components are shaped, excess high-purity alumina powder is collected, processed, and then reused. Components for our other products also undergo final precision machining to protect the proprietary nature of our manufacturing methods and product designs and to maintain premium quality standards. In addition, the availability of multiple test loops allows us to test every water product we manufacture to its full operating conditions. These test loops, which are a major driver of our water usage, have been modified to allow us to recycle most of the water used in these testing cycles.
We obtain raw, processed and certain pre-machined materials from various suppliers to support our manufacturing operations. A limited number of these suppliers are single source to maintain material consistency and support new product development. A qualified redundant source exists in a majority of cases. Through our vertically integrated ceramics precision manufacturing process, we ensure that all components meet our high standards for quality, durability, and reliability.
Our Texas facility is focused on the machining, assembly and testing of tungsten carbide components, which we source from global manufacturers. This facility can also be used to augment alumina ceramics manufacturing as, and if, needed.
We are committed to reducing the environmental impact of our operations. We recognize that as we pursue our strategy of diversified and disciplined growth, our operations and our impact on the environment, may increase. Some of the ways we currently seek to minimize our environmental impact are by reducing consumption of resources through waste management strategies, optimizing the use of renewable energy, and monitoring key environmental indicators. Our efforts to measure and manage our impact will continue to evolve as our business grows. As a commitment to the sustainability of our operations, we are pursuing certification to ISO14001, the international standard for environmental management systems, with a goal to complete certification by the end of fiscal year 2022.
Our production facilities operate under the principles of Lean Manufacturing, and we continuously seek ways to improve product and process performance. Our quality management system is certified to ISO9001:2015 and our safety management system to the ISO45001 standard.
Energy Recovery, Inc. | 2021 Form 10-K Annual Report | 11
Research, Development and Technology
Today our investments into R&D are focused on (1) advancing our solutions to better service historical markets, such as desalination; (2) applying our pressure exchanger technology to new markets, such as our recent entries into the industrial wastewater and refrigeration markets; and (3) fundamental research into new applications of our pressure exchanger technology in existing and new verticals.
At the onset of any technology project, we set stringent financial and commercial parameters, such as profitability and market size, to benchmark our success, including these time-based restrictions: (1) our R&D team must prove any new technologies are viable within 12 months; (2) we must commercialize new products within 24 months of project inception; and (3) we must achieve a breakeven run rate within 36 months of inception. In addition, we consider broader implications of a new product’s impact on environmental and social issues as part of business case development.
We recognize the importance of carefully stewarding resources to support our ongoing R&D program. We maintain advanced analytical and testing capabilities to evaluate our solutions at all company sites. We have developed complex analytical tools which allow us to be less reliant on full-scale testing that is costly and often uses considerable amounts of water and consumable energy. Our advanced numerical modeling and analytical tools allows for 3-dimensional (“3D”), multi-phase, multi-physics, and multi-scale, computational fluid dynamics, fluid structure interactions, thermodynamics and system analysis. Leading-edge modeling and analytical techniques coupled with extensive state of the art experimental capabilities allow us to further refine our existing water, refrigeration and oil & gas technologies, as well as developing new derivatives of our pressure exchanger technology for complex systems and applications.
Our world-class engineers specialize in a range of technical fields critical to support our current product lines and advance our incubation initiatives, including core engineering competencies of fluid mechanics and aerodynamics, solid mechanics with expertise in computational fluid dynamics and finite element analysis, bearings design (roller-element, hydrostatic, and hydrodynamic), multi-phase flow, dynamics and controls, acoustics and vibrations, tribology, material science and coatings, pumps and turbines, turbo-machinery, and rotating equipment.
Information Technology
We rely on our information technology (“IT”) and data systems in connection with many of our business activities. As the role of technology in our business expands, so too does the importance of cybersecurity. We take protecting our brand, systems, data, intellectual property, and customer and employee information, seriously. We actively monitor and manage our IT for security risks (e.g., cybersecurity risks), and look to mitigate these risks through enterprise-wide programs, annual employee training and vulnerability assessments. We have made, and continue to make, investments in a skilled IT workforce and critical technologies.
Our enterprise-wide programs include endpoint security and encryption, network intrusion prevention and detection, a system for managing and installing security patches, updates for third-party applications, and security information and event management (“SIEM”) systems that monitor our infrastructure and alert our security operations center of potential cybersecurity issues. We strictly regulate and limit all access to servers and networks at our facilities. Local network access is restricted by domain authentication, using stringent access control lists and virtual local area networks (“VLAN”). We have built additional layers of security for remote-work access to applications and services, such as software-defined perimeters (“SDP”), zero trust network access, and multi-factor authentication (“MFA”). Our IT department regularly performs penetration testing and we engage a third-party penetration testing company to conduct penetration tests to identify and remediate any issues.
Under our enterprise-wide approach to risk management, cybersecurity is “high-level” risk that is reported to, and overseen by, our Audit Committee of the Board of Directors, which consists of four non-employee independent directors, of which one of these directors has information systems experience. In addition to the enterprise-wide initiatives, we purchase cybersecurity insurance to protect against a wide range of costs that could be incurred in connection with cybersecurity-related incidents. We continually strengthen and enhance our programs and controls around people, process and technology, and apply risk-based strategies to enhance prevention, detection, and response efforts.
Intellectual Property
We seek patent protection for new technologies, inventions, and improvements that are likely to be incorporated into our solutions. We rely on patents, trade secret laws, and contractual safeguards to protect the proprietary tooling, processing techniques, and other know-how used in the production of our solutions. We have a robust intellectual property (“IP”) portfolio consisting of U.S. and international issued patents as well as pending patent applications.
Energy Recovery, Inc. | 2021 Form 10-K Annual Report | 12
We have registered the following trademarks with the United States Patent and Trademark office: “ERI,” “PX,” “PX Pressure Exchanger,” “Pressure Exchanger,” “Ultra PX,” “PX PowerTrain,” “IsoBoost,” the Energy Recovery logo, and “Making Desalination Affordable.” Application is pending for “PX G1300,” “PX G,” and “VorTeq.” We have also applied for and received registrations in international trademark offices.
Human Capital Resources
Our employees are key to our company’s success. Our unparalleled PX ingenuity, increasing sales and related production growth are all enabled by our employees. Our company is built around innovation and driven by diversity of thought and background. We need employees to challenge the status quo, actively partner to resolve challenges, and seek to continuously improve themselves as well as our operations. We strive for an exciting, safe, and collaborative work environment. We are proud of this culture and believe it creates a vital competitive advantage.
As of December 31, 2021, we had 222 full-time employees, which include both permanent and leased employees, primarily as sales and service agents worldwide, and IT support. Our employees are not unionized and we consider our relations with our employees to be good.
Our Code of Business Conduct (our “Code”) serves as a critical tool to help all of us recognize and report unethical conduct, while preserving and nurturing our culture. Our Code is reflected in our employee manual and training programs, including our policies against harassment and bullying, and the elimination of bias in the workplace, which we provide to all of our employees.
Our focus is to create an engaged employee experience, throughout the process of attracting, onboarding, developing, and retaining employees. We are committed to supporting employee development as well as providing competitive benefits and a safe workplace. Our employee engagement efforts include newsletters and all-employee town hall meetings, as well as small group informational settings, through which we aim to keep our employees well-informed and to increase transparency and open communication. In addition, we provide periodic employee training and development through which we strive to educate and enhance our employee’s financial, mental, and physical wellness.
In addition to managing the COVID-19 pandemic and all the ways it has impacted our employees’ lives, we took the virtual meeting opportunity to connect and engage our company’s leaders and technical project influencers, from across the globe, by facilitating numerous leadership development sessions. These sessions empower our company’s leaders to improve their communication and recognize diversity of thought as a true benefit to teamwork.
Our compensation and benefit programs are designed to recognize our employees’ contributions to value ingenuity and business results, including variable pay, which rewards each employee for company and individual performance. In addition, all full-time employees and equivalents are included in share-based equity award grants, health and welfare benefits, including mental wellness, time-off, development programs and training, and opportunities to give back to our communities through donations of time and money.
Employee safety remains our top priority. To accomplish our safety goals, we developed and maintain company-wide policies to ensure the safety of each employee, as well as compliance with Occupational Safety and Health Administration (“OSHA”), and the internationally recognized ISO45001 standards. In our continued response to the COVID-19 pandemic, we implemented safety protocols and procedures to protect our employees, and subcontractors and customers who work at, or visit, our facilities. These protocols, which are reviewed on a periodic basis in accordance with the Centers for Disease Control and Prevention (“CDCP”) and other federal, state and local government agencies public health guidelines, include complying with social distancing and other prescribed health and safety standards. In addition, we modified the way we conduct many aspects of our business to reduce the number of in-person interactions, such as significantly expanding the use of virtual interactions in all aspects of our business, including customer facing activities. In addition, we implemented additional safety measures over and above legally mandated protocols such as weekly COVID-19 testing of employees and visitors, which provides an added layer of trust and comfort for our employees. These safety protocols are reviewed on a periodic basis and will be adjusted as the pandemic progresses.
Energy Recovery, Inc. | 2021 Form 10-K Annual Report | 13
Additional Information
Our website is www.energyrecovery.com. We also maintain an Investor Relations website as a routine channel for distribution of important information, including news releases, presentations, and financial statements (https://ir.energyrecovery.com). We intend to use our Investor Relations website as a means of complying with our disclosure obligations under Regulation FD. Accordingly, investors should monitor our Investor Relations website in addition to press releases, Securities and Exchange Commission (“SEC”) filings, and public conference calls and webcasts. Our Annual Report on Form 10‑K, Quarterly Reports on Form 10‑Q, Current Reports on Form 8‑K, all amendments to those reports, and the Proxy Statement for our Annual Meeting of Stockholders are made available, free of charge, in the Investor Relations section of our website, as soon as reasonably practicable after the reports have been filed with, or furnished to, the SEC. The information contained on our website or any other website is not part of this report nor is it considered to be incorporated by reference herein or with any other filing we make with the SEC. Our headquarters and primary manufacturing center is located at 1717 Doolittle Drive, San Leandro, California 94577, and our main telephone number is (510) 483-7370. The SEC maintains an internet site that contains reports, proxy and information statements and other information regarding issuers that file electronically with the SEC and the address of that site (http://www.sec.gov).
Item 1A — Risk Factors
The following discussion sets forth what management currently believes could be the most significant risks and uncertainties that could impact our businesses, results of operations, and financial condition. Other risks and uncertainties, including those not currently known to us or our management, could also negatively impact our businesses, results of operations, and financial conditions. Accordingly, the following should not be considered a complete discussion of all of the risks and uncertainties we may face. We may amend or supplement these risk factors from time to time in other reports we file with the SEC.
Risks Related to our Water Segment
Our Water segment revenues depend on the construction of new desalination plants, and the retrofit of existing plants, and as a result, our operating results have experienced, and may continue to experience, significant variability due to volatility in capital spending, availability of project financing, and other factors affecting the water desalination industry.
We currently derive the majority of our Water segment revenues from sales of products and services used in desalination plants for municipalities, hotels, mobile containerized desalination solutions, resorts, and agricultural operations in dry or drought-ridden regions of the world. The demand for our products used in the Water segment may decrease if the construction of desalination plants or the retrofit of existing plants, declines for political, economic, or other factors, especially in dry or drought-ridden regions. In addition, the desalination industry has been experiencing a technology shift from thermal desalination plants to SWRO production. If this technology shift does not continue or we are unable to capture a portion of the market created by this shift, our Water segment sales and revenue can be negatively impacted.
Other factors that could affect the number and capacity of desalination plants built or the timing of their completion, include the availability of required engineering and design resources; a weak global economy; shortage in the supply of credit and other forms of financing; changes in government regulation, permitting requirements, or priorities; and reduced capital spending for desalination. Each of these factors could result in reduced or uneven demand for our products. Pronounced variability or delays in the construction of desalination plants or reductions in spending for desalination, could negatively impact our Water segment sales and revenue, which in turn could have an adverse effect on our entire business, financial condition, or results of operations and make it difficult for us to accurately forecast our future sales and revenue.
Energy Recovery, Inc. | 2021 Form 10-K Annual Report | 14
Our Water segment faces competition from a number of companies that offer competing energy recovery and pump solutions. If any one of these companies produces superior technology or offers more cost-effective products, our competitive position in the market could be harmed and our profits may decline.
The market for ERD and pumps for desalination plants is competitive and evolving. We expect competition to persist and intensify as the desalination market continues to grow. We expect new competitors to enter the market and existing competitors to introduce improvements to their existing products and new products that are directly competitive to our energy recovery and pump solutions. These improved and new products may be superior to our products and/or could be offered at prices that are considerably less than the cost of our products. The performance and pricing pressure of such new products could cause us to adjust the prices of certain products to stay competitive, or we may not be able to continue to win large contracts, which could adversely affect our market share, competitive position and margins. Some of our current and potential competitors may have significantly greater financial, technical, marketing, and other resources; longer operating histories; or greater name recognition. They may also have more extensive products and product lines that would enable them to offer multi-product or packaged solutions as well as competing products at lower prices or with other more favorable terms and conditions. As a result, our ability to sustain our market share may be adversely impacted, which would affect our business, product margins, operating results, and financial condition. In addition, if one of our competitors were to merge or partner with another company, the change in the competitive landscape could adversely affect our continuing ability to compete effectively.
A sustained downturn in the economy or prolonged lower oil prices, could impact future desalination plants and the retrofit of existing plants, which could result in decreased demand for our water products and services.
The demand for our water products and services depends primarily on the continued construction of new large scale desalination plants and the retrofit of existing plants, particularly in the countries that make up the Gulf Cooperation Council (“GCC”). The recent economic decline caused by the spread of COVID-19 or a prolonged decrease in oil prices, may have a negative economic impact on these and other countries, which may impact the availability of project financing for new desalination and retrofit projects, such as the ability to secure credit for these projects, which would result in the postponement or cancellation, and/or change government priorities or otherwise reduce spending for desalination projects, each of which could result in decreased demand for our products and services, which could have an adverse effect on our entire business, financial condition or results of operations.
We are subject to risks related to product defects, which could lead to warranty claims in excess of our warranty provision or result in a significant or a large number of warranty or other claims in any given year.
We provide a warranty for certain products for a period of 18 to 30 months and provide up to a five-year warranty for the ceramic components of our PX-branded products. We test our products in our manufacturing facilities through a variety of means; however, there can be no assurance that our testing will reveal latent defects in our products, which may not become apparent until after the products have been sold into the market. The testing may not replicate the harsh, corrosive, and varied conditions of the desalination and other plants in which they are installed. It is also possible that components purchased from our suppliers could break down under those conditions. Certain components of our Turbochargers and pumps are custom-made and may not scale or perform as required in production environments. Accordingly, there is a risk that we may have significant warranty claims or breach supply agreements due to product defects. We may incur additional cost of revenue if our warranty provisions are not sufficient to cover the actual cost of resolving issues related to defects in our products. If these additional expenses are significant, they could adversely affect our business, financial condition, and results of operations.
Energy Recovery, Inc. | 2021 Form 10-K Annual Report | 15
Risks Related to our Emerging Technologies
Our diversification into new fluid flow markets, such as commercial refrigeration and IWW, may not be successful.
We have made a substantial investment in R&D and sales to execute on our diversification strategy into fluid flow markets such as commercial refrigeration and IWW. While we see diversification as core to our growth strategy, there is no guarantee that we will be successful in our efforts. Our model for growth is based in part on our ability to initiate and embrace disruptive technology trends, to enter new markets, both in terms of geographies and product areas, and to drive broad adoption of the products and services that we develop and market. Our competitive position and future growth depend upon a number of factors, including our ability to successfully: (i) innovate, develop and maintain competitive products, and services to address emerging trends and meet customers’ needs, (ii) defend our market share against an ever-expanding number of competitors, (iii) enhance our product and service offerings by adding innovative features or disruptive technologies that differentiate them from those of our competitors and prevent commoditization, (iv) develop, manufacture and bring compelling new products and services to market quickly and cost-effectively, (v) attract, develop and retain individuals with the requisite innovation and technical expertise and understanding of customers’ needs to develop new technologies, products and services, (vi) continue to invest in manufacturing, research and development, engineering, sales and marketing, and customer support. Any inability to execute this model for growth could damage our reputation, limit our growth, and negatively affect our operation results. In addition, profitability, if any, in new industrial verticals may be lower than in our Water segment, and we may not be sufficiently successful in our diversification efforts to recoup investments. The failure of our technologies, products or services to maintain and gain market acceptance due to more attractive offerings, or customers’ slower-than-expected adoption of and investment in our new and innovative technologies could significantly reduce our revenues or market share and adversely affect our competitive position.
We may not be able to successfully complete development, launch or commercialize our CO2 refrigeration technology.
We introduced the PX G1300 in 2021 and continue to work on the development and commercialization of our CO2 refrigeration technology. While testing of the technology has continued to be promising, there remain a wide range of technological challenges for us that we will need to solve in order to launch the technology for commercial use. We may not be successful in solving these challenges and, as a result, may not be able to successfully complete the launch of the technology. Even if we are able to complete the launch, we may not be able to generate sufficient interest in our technology or commercialize the technology. The commercial refrigeration industry is also saturated with very large, established companies who have greater experience and resources than us and there are competing products and technologies that compete against the PX G1300. If we are unable to solve the technological challenges, launch and generate sufficient interest for our CO2 refrigeration technology, we may not be able to successfully commercialize the technology, which could have an adverse effect on our entire business, financial condition, or results of operation.
We may not be able to successfully compete in the IWW market.
The IWW market covers a wide range of industries and geographies and utilizes a variety of RO technologies. While our products can be applied to each of these stages, there is no guarantee that we will be successful in marketing and selling our products to the end users. Similar to the SWRO market, there are many competitors and competitive products that can service the IWW industry. These competitors may have existing relationships with end users, greater name recognition or significantly greater financial, technical, marketing and other resources that may make it challenging for us to compete in this industry. In addition, the IWW market is evolving. While countries like China and India are beginning to mandate ZLD or MLD requirements for specific industries, in many parts of the world there are no or minimal regulations for treating wastewater. Accordingly, end users in such areas may not be willing to make the financial investment for our products. As a result of the foregoing, we may not be able to successfully develop our IWW business, develop any market share, or win any large contracts, which would affect our business, operating results and financial condition.
We may not be able to successfully find a suitable collaboration partner to commercialize the VorTeq.
The VorTeq technology remains a relatively new technology and the hydraulic fracturing process is extremely complex, which presents a wide range of technological challenges for us. The successful commercialization of the VorTeq depends heavily on the support of fracking operators and ultimate adoption of the technology by these companies. We have begun to focus our efforts on seeking a suitable collaboration partner to bring VorTeq to completion and subsequently commercialize the technology. Even if we do find a suitable collaboration partner, if the hydraulic fracturing operators fail to adopt the VorTeq technology, for any reason, we may not be able to successfully commercialize the VorTeq technology and we may not receive any return on our research and development investment. If we fail to commercialize the VorTeq technology or find a suitable collaboration partner, we may not be able to successfully commercialize the VorTeq technology and will instead shut down the VorTeq project, which may have an adverse effect on our entire business, financial condition, or results of operation.
Energy Recovery, Inc. | 2021 Form 10-K Annual Report | 16
Risks Related to our General Business
Our operating results may fluctuate significantly, making our future operating results difficult to predict and causing our operating results to fall below expectations.
Our operating results may fluctuate due to a variety of factors, many of which are outside of our control. We have experienced significant fluctuations in revenue from quarter-to-quarter and year-to-year, and we expect such fluctuations to continue. In addition, in the past, customer buying patterns led to a significant portion of our sales occurring in the fourth quarter. This presents the risk that delays, cancellations, or other adverse events in the fourth quarter could have a substantial negative impact on annual results. As a result, comparing our operating results on a period-to-period basis may not be meaningful. Since it is difficult for us to anticipate our future results, in the event our revenue or operating results fall below the expectations of investors or securities analysts, our stock price may decline.
Our sales cycles can be long and unpredictable, and our sales efforts require considerable time and expense. As a result, our sales are difficult to predict and may vary substantially from quarter to quarter, which may cause our operating results to fluctuate.
Our sales efforts involve substantial education of our current and prospective customers about the use and benefits of our energy recovery products. This education process can be time-consuming and typically involves a significant product evaluation process which is particularly pronounced when dealing with product introduction into new fluid flow industrial verticals. In our Water segment, the average sales cycle for our OEM customers, which are involved with smaller desalination plants, ranges from one to 12 months. The average Water segment sales cycle for our international EPC firm customers, which are involved with larger desalination plants, range from 16 to 36 months, or more. These long sales cycles make quarter-by-quarter revenue predictions difficult and results in our expending significant resources well in advance of orders for our products.
Our business entails significant costs that are fixed or difficult to reduce in the short term while demand for our products is variable and subject to fluctuation, which may adversely affect our operating results.
Our business requires investments in facilities, equipment, research and development, and training that are either fixed or difficult to reduce or scale in the short term. At the same time, the market for our products is variable and has experienced downturns due to factors such as economic recessions, increased precipitation, uncertain global financial markets, and political changes, many of which are outside of our control. During periods of reduced product demand, we may experience higher relative costs and excess manufacturing capacity, resulting in high overhead and lower gross profit margins while causing cash flow and profitability to decline. Similarly, although we believe that our existing manufacturing facilities are capable of meeting current demand and demand for the foreseeable future, the continued success of our business depends on our ability to expand our manufacturing, research and development, and testing facilities to meet market needs. If we are unable to respond timely to an increase in demand, our revenue, gross profit margin, net income, and cash flow may be adversely affected.
If we are unable to collect unbilled receivables, which are caused in part by holdback provisions, our operating results could be adversely affected.
Our contracts with large EPC firms generally contain holdback provisions that typically delay final installment payments for our products by up to 24 months, after the product has been shipped and revenue has been recognized. Generally, 10% or less of the revenue we recognize pursuant to our customer contracts is subject to such holdback provisions and is accounted for as contract assets. Such holdbacks may result in relatively high unbilled receivables. If we are unable to collect these performance holdbacks, our results of operations would be adversely affected.
Energy Recovery, Inc. | 2021 Form 10-K Annual Report | 17
We depend on a limited number of suppliers for some of our components. If our suppliers are not able to meet our demand and/or requirements, our business could be harmed.
We rely on a limited number of suppliers for vessel housings, stainless steel ports, alumina powder, and tungsten carbide for our portfolio of ERDs and stainless steel castings and components for our Turbochargers and pumps. Our reliance on a limited number of manufacturers for these supplies involves several risks, including reduced control over delivery schedules, quality assurance, manufacturing yields, production costs, and lack of guaranteed production capacity or product supply. We do not have long-term supply agreements with these suppliers but secure these supplies on a purchase order basis. Our suppliers have no obligation to supply products to us for any specific period, in any specific quantity, or at any specific price, except as set forth in a particular purchase order. Our requirements may represent a small portion of the total production capacities of these suppliers, and our suppliers may reallocate capacity to other customers, even during periods of high demand for our products. We have in the past experienced, and may in the future experience, product quality issues and delivery delays with our suppliers due to factors such as high industry demand or the inability of our vendors to consistently meet our quality or delivery requirements. If our suppliers were to cancel or materially change their commitments to us or fail to meet quality or delivery requirements needed to satisfy customer orders for our products, we could lose time-sensitive customer orders, be unable to develop or sell our products cost-effectively or on a timely basis, if at all, and have significantly decreased revenue, which could harm our business, operating results, and financial condition. We may qualify additional suppliers in the future, which would require time and resources. If we do not qualify additional suppliers, we may be exposed to increased risk of capacity shortages due to our dependence on current suppliers.
Parts of our inventory may become excess or obsolete, which would increase our cost of revenues.
Inventory of raw materials, parts, components, work in-process, or finished products may accumulate, and we may encounter losses due to a variety of factors, including technological change in the water desalination, IWW and refrigeration markets that result in product changes; long delays in shipment of our products or order cancellations; our need to order raw materials that have long lead times and our inability to estimate exact amounts and types of items needed, especially with regard to the configuration of our high-efficiency pumps and IsoBoost system; and cost reduction initiatives resulting in component changes within the products.
In addition, we may, from time-to-time, purchase more inventory than is immediately required in order to shorten our delivery time in case of an anticipated increase in demand for our products. If we are unable to forecast demand for our products with a reasonable degree of certainty and our actual orders from our customers are lower than these forecasts, we may accumulate excess inventory that we may be required to write off, and our business, financial condition, and results of operations could be adversely affected.
We may not generate positive returns on our research and development strategy.
Developing our products is expensive and the investment in product development may involve a long payback cycle. While we believe one of our greatest strengths lies in our innovation and our product development efforts, successfully commercializing such efforts and generating a return can be difficult. We expect that our results of operations may be impacted by the timing and size of these investments. In addition, these investments may take several years to generate positive returns, if ever.
Business interruptions may damage our facilities or those of our suppliers.
Our operations and those of our suppliers may be vulnerable to interruption by fire, earthquake, flood, and other natural disasters, as well as power loss, telecommunications failure, and other events beyond our control. Our headquarters in California is located near major earthquake faults and has experienced earthquakes in the past. In addition, our facilities in California are located in areas that are subject to public safety power shutdowns (“PSPS”). If a natural disaster occurs or we are subject to PSPS, our ability to conduct our operations could be seriously impaired, which could harm our business, financial condition, results of operations, and cash flows. We cannot be sure that the insurance we maintain against general business interruptions will be adequate to cover all of our losses.
Energy Recovery, Inc. | 2021 Form 10-K Annual Report | 18
We are, from time to time, involved in legal proceedings, and may be subject to additional future legal proceedings, that may result in material adverse outcomes.
In addition to the IP litigation risks, we may become involved in the future, in various commercial and other disputes as well as related claims and legal proceedings that arise from time to time in the course of our business. See Note 7, “Commitments and Contingencies – Litigation,” of the Notes for information about certain legal proceedings in which we are involved. Our current legal proceedings and any future lawsuits to which we may become a party are, and will likely be, expensive and time consuming to investigate, defend and resolve, and will divert our management’s attention. Any litigation to which we are a party may result in an onerous or unfavorable judgment that may not be reversed upon appeal or in payments of substantial monetary damages or fines, or we may decide to settle lawsuits on similarly unfavorable terms, which could have an adverse effect on our business, financial condition, or results of operations.
Our actual operating results may differ significantly from our guidance.
We release guidance in our quarterly earnings conference calls, quarterly earnings releases, or otherwise, regarding our future performance that represents our management’s estimates as of the date of release. This guidance, which includes forward-looking statements, will be based on projections prepared by our management. These projections will not be prepared with a view toward compliance with published guidelines of the American Institute of Certified Public Accountants, and neither our registered public accountant nor any other independent expert or outside party compiles or examines the projections. Accordingly, no such person will express any opinion or any other form of assurance with respect to the projections.
Projections are based upon a number of assumptions and estimates that, while presented with numerical specificity, are inherently subject to significant business, economic and competitive uncertainties and contingencies, many of which are beyond our control and are based upon specific assumptions with respect to future business decisions, some of which will change. We will continue to state possible outcomes as high and low ranges which are intended to provide a sensitivity analysis as variables are changed but are not intended to imply that actual results could not fall outside of the suggested ranges. The principal reason that we release guidance is to provide a basis for our management to discuss our business outlook with analysts and investors. We do not accept any responsibility for any projections or reports published by any such third parties.
Guidance is necessarily speculative in nature, and it can be expected that some or all of the assumptions underlying the guidance furnished by us will not materialize or will vary significantly from actual results. Accordingly, our guidance is only an estimate of what management believes is realizable as of the date of release. Actual results may vary from our guidance and the variations may be material. In light of the foregoing, investors are urged not to rely upon our guidance in making an investment decision regarding our common stock.
Any failure to successfully implement our operating strategy or the occurrence of any of the events or circumstances set forth in this “Risk Factors” section in this Annual Report on Form 10-K could result in the actual operating results being different from our guidance and the differences may be adverse and material.
In preparing our financial statements we make certain assumptions, judgments and estimates that affect amounts reported in our consolidated financial statements, which, if not accurate, may significantly impact our financial results.
We make assumptions, judgments and estimates for a number of items, including the fair value of financial instruments, goodwill, long-lived assets and other intangible assets, the realizability of deferred tax assets, the recognition of revenue and the fair value of stock awards. We also make assumptions, judgments and estimates in determining the accruals for employee-related liabilities, including commissions and variable compensation, and in determining the accruals for uncertain tax positions, valuation allowances on deferred tax assets, allowances for doubtful accounts, and legal contingencies. These assumptions, judgments and estimates are drawn from historical experience and various other factors that we believe are reasonable under the circumstances as of the date of the consolidated financial statements. Actual results could differ materially from our estimates, and such differences could significantly impact our financial results.
Energy Recovery, Inc. | 2021 Form 10-K Annual Report | 19
Our global operations expose us to risks and challenges associated with conducting business internationally, and our results of operations may be adversely affected by our efforts to comply with the laws of other countries, as well as U.S. laws which apply to international operations, such as the U.S. Foreign Corrupt Practices Act (“FCPA”) and U.S. export control laws.
We operate on a global basis with offices or activities in Europe, Africa, Asia, South America and North America. We face risks inherent in conducting business internationally, including compliance with international and U.S. laws and regulations that apply to our international operations. These laws and regulations include tax laws, anti-competition regulations, import and trade restrictions, export control laws, and laws which prohibit corrupt payments to governmental officials or certain payments or remunerations to customers, including the U.S. FCPA or other anti-corruption laws that have recently been the subject of a substantial increase in global enforcement. Many of our products are subject to U.S. export law restrictions that limit the destinations and types of customers to which our products may be sold, or require an export license in connection with sales outside the U.S. Given the high level of complexity of these laws, there is a risk that some provisions may be inadvertently or intentionally breached, for example, through fraudulent or negligent behavior of individual employees, our failure to comply with certain formal documentation requirements, or otherwise. Also, we may be held liable for actions taken by our local dealers and partners. Violations of these laws and regulations could result in fines, criminal sanctions against us, our officers or our employees, and prohibitions or conditions on the conduct of our business. Any such violations could include prohibitions or conditions on our ability to offer our products in one or more countries and could materially damage our reputation, our brand, our business, and our operating results. In addition, we operate in many parts of the world that have experienced significant governmental corruption to some degree and, in certain circumstances, strict compliance with anti-bribery laws may conflict with local customs and practices. We may be subject to competitive disadvantages to the extent that our competitors are able to secure business, licenses, or other preferential treatment by making payments to government officials and others in positions of influence or through other methods that relevant law and regulations prohibit us from using. Our success depends, in part, on our ability to anticipate these risks and manage these difficulties. These factors or any combination of these factors may adversely affect our revenue or our overall financial performance.
ESG issues, including those related to climate change and sustainability, may have an adverse effect on our business, financial condition and results of operations and damage our reputation.
There is an increasing focus from certain investors, customers, consumers, employees and other stakeholders concerning ESG matters. Additionally, public interest and legislative pressure related to public companies’ ESG practices continue to grow. If our ESG practices fail to meet regulatory requirements or investor, customer, employee or other stakeholders’ evolving expectations and standards for responsible corporate citizenship (in areas including environmental stewardship, support for local communities, Board of Director and employee diversity, human capital management, employee health and safety practices, product quality, supply chain management, corporate governance and transparency) our reputation, brand and employee retention may be negatively impacted, and our customers and suppliers may be unwilling to continue to do business with us.
Customers, investors and other stakeholders are increasingly focusing on environmental issues, including climate change, energy and water use, industrial waste and other sustainability concerns. Concern over climate change may result in new or increased legal and regulatory requirements to reduce or mitigate impacts to the environment. Changing customer preferences or increased regulatory requirements may result in increased demands or requirements regarding certain components of our products and their environmental impact on sustainability, or increased customer concerns or perceptions (whether accurate or inaccurate) regarding the effects of substances present in certain of our products. Complying with these demands or requirements could cause us to incur additional manufacturing, operating or product development costs.
If we do not adapt to or comply with new regulations, or fail to meet evolving investor, industry or stakeholder expectations and concerns regarding ESG issues, investors may reconsider their capital investment in our company, and customers may choose to stop purchasing our products, which could have a material adverse effect on our reputation, business or financial condition.
Energy Recovery, Inc. | 2021 Form 10-K Annual Report | 20
Uncertainty in the global geopolitical landscape may impact our operations outside the U.S.
There is uncertainty as to the position the U.S. will take with respect to world affairs. This uncertainty may include such issues as U.S. support for existing treaty and trade relationships with other countries, including, notably, China. This uncertainty, together with other recent key global events, such as recently enacted currency control regulations and tariff regimes in or against China, ongoing terrorist activity, and potential hostilities in the Middle East, may adversely impact (i) the ability or willingness of non-U.S. companies to transact business in the U.S., including with us; (ii) our ability to transact business in other countries, including the Middle East, where many of the water megaprojects are planned; (iii) regulation and trade agreements affecting U.S. companies; (iv) global stock markets (including The Nasdaq Global Market on which our common shares are traded); and (v) general global economic conditions. Furthermore, in connection with increasing tensions related to the ongoing conflict between Russia and Ukraine, the U.S. government has stated it is considering imposing enhanced export controls on certain products and sanctions on certain industry sectors and parties in Russia. Further escalation of geopolitical tensions could have a broader impact that expands into other markets where we do business, which could adversely affect our business and/or our supply chain, business partners or customers in the broader region. All of these factors are outside of our control, but may nonetheless cause us to adjust our strategy in order to compete effectively in global markets.
Acts of War or Terrorism.
Threats or acts of war or terrorism can adversely affect our business. Terrorist attacks in the U.S., Europe and in other countries, and continuing hostilities in the Middle East and elsewhere have created significant instability and uncertainty in the world. These and future events may have a material adverse effect on world financial markets as well as the water industry, as many large existing and planned water desalination plants are located in the Middle East. In addition, threats or acts of war or terrorism can cause our customers to curtail their purchase of our products. These factors or any combination of these factors may adversely affect our revenue or our overall financial performance.
Changes in the method of determining the London Interbank Offered Rate (“LIBOR”), or the replacement of LIBOR with an alternative reference rate, may adversely affect our financial condition and results of operations.
Certain of our financial obligations and instruments, including our Credit Agreement with JPMorgan Chase Bank, N.A., dated December 22, 2021, are, or may be, made at variable interest rates that use LIBOR (or metrics derived from or related to LIBOR) as a benchmark for establishing the interest rate.
On July 27, 2017, the United Kingdom’s Financial Conduct Authority, which regulates the entity that calculates LIBOR, announced that LIBOR should be phased out by the end of 2021. Subsequently, on March 5, 2021, LIBOR’s administrator announced that publication of overnight, one-month, three-month, six-month and 12-month U.S. dollar LIBOR would cease immediately following publication of such interest rates on June 30, 2023, and that publication of all other currency and tenor variants would cease immediately following publication on December 31, 2021. The U.S. Federal Reserve, in conjunction with the Alternative Reference Rates Committee, a steering committee comprised of large U.S. financial institutions and other market participants, is considering replacing U.S. dollar LIBOR with a new index calculated by short-term repurchase agreements, backed by Treasury securities (“SOFR”). Whether or not SOFR attains market traction as a LIBOR replacement tool remains in question. SOFR is observed and backward looking, which stands in contrast with LIBOR under the current methodology, which can be an estimated forward-looking rate and relies, to some degree, on the expert judgment of submitting panel members. Given that SOFR is a secured rate backed by government securities, it will be a rate that does not take into account bank credit risk (as is the case with LIBOR).
If LIBOR ceases to exist prior to the maturity of our contracts, we will be required to substitute an index such as the Prime Rate that utilize LIBOR as the reference rate, and substitute an index to replace LIBOR with the new standard that is established. If we borrow under the Prime Rate, we may see increased borrowing costs until the agreements are amended or renegotiated to incorporate the new SOFR borrowing rate or another substitute index. This could materially and adversely affect our results of operations, cash flows, and liquidity.
Energy Recovery, Inc. | 2021 Form 10-K Annual Report | 21
If we need additional capital to fund future growth, it may not be available on favorable terms, or at all.
Our primary source of cash historically has been customer payments for our products and services and proceeds from the issuance of common stock. This has funded our operations and capital expenditures. We may require additional capital from equity or debt financing in the future to fund our operations or respond to competitive pressures or strategic opportunities, such as a potential acquisition or the expansion of operations. We may not be able to secure such additional financing on favorable terms, or at all. The terms of additional financing may place limits on our financial and operational flexibility. If we raise additional funds through further issuances of equity, convertible debt securities, or other securities convertible into equity, our existing stockholders could suffer significant dilution in their percentage ownership of our company, and any new securities that we issue could have rights, preferences, or privileges senior to those of existing or future holders of our common stock. If we are unable to obtain necessary financing on terms satisfactory to us, if and when we require it, our ability to grow or support our business and to respond to business challenges or opportunities could be significantly limited.
We may seek to expand through acquisitions of and investments in other businesses, technologies, and assets. These acquisition activities may be unsuccessful or divert management’s attention.
We may consider strategic and complementary acquisitions of and investments in other businesses, technologies, and assets, and such acquisitions or investments are subject to risks that could affect our business, including risks related to:
•the necessity of coordinating geographically disparate organizations;
•implementing common systems and controls;
•integrating personnel with diverse business and cultural backgrounds;
•integrating acquired research and manufacturing facilities, technology and products;
•combining different corporate cultures and legal systems;
•unanticipated expenses related to integration, including technical and operational integration;
•increased costs and unanticipated liabilities, including with respect to registration, environmental, health and safety matters, that may affect sales and operating results;
•retaining key employees;
•obtaining required government and third-party approvals;
•legal limitations in new jurisdictions;
•installing effective internal controls and audit procedures;
•issuing common stock that could dilute the interests of our existing stockholders;
•spending cash and incurring debt;
•assuming contingent liabilities; and
•creating additional expenses.
We may not be able to identify opportunities or complete transactions on commercially reasonable terms, or at all, or actually realize any anticipated benefits from such acquisitions or investments. Similarly, we may not be able to obtain financing for acquisitions or investments on attractive terms. If we do complete acquisitions, we cannot ensure that they will ultimately strengthen our competitive or financial position or that they will not be viewed negatively by customers, financial markets, investors, or the media. In addition, the success of any acquisitions or investments also will depend, in part, on our ability to integrate the acquisition or investment with our existing operations.
The integration of businesses that we may acquire is likely to be a complex, time-consuming, and expensive process and we may not realize the anticipated revenues or other benefits associated with our acquisitions if we fail to successfully manage and operate the acquired business. If we fail in any acquisition integration efforts and are unable to efficiently operate as a combined organization utilizing common information and communication systems, operating procedures, financial controls, and human resources practices, our business, financial condition, and results of operations may be adversely affected.
Energy Recovery, Inc. | 2021 Form 10-K Annual Report | 22
In connection with certain acquisitions, we may agree to issue common stock or assume equity awards that dilute the ownership of our current stockholders, use a substantial portion of our cash resources, assume liabilities, record goodwill and amortizable intangible assets that will be subject to impairment testing on a regular basis and potential periodic impairment charges, incur amortization expenses related to certain intangible assets, and incur large and immediate write-offs and restructuring and other related expenses, all of which could harm our financial condition and results of operations.
Our success depends, in part, on key personnel whose continued service is not guaranteed.
Our success depends, in part, on the continued availability and service of key personnel, including executive officers and other highly qualified employees, and competition for their talents is intense. There is substantial competition for qualified personnel. We cannot assure that we will retain our key personnel or that we will be able to recruit and retain other highly qualified employees in the future. Losing any key personnel could, at least temporarily, have a material adverse effect on our business, financial position and results of operations.
Risks Related to COVID-19
We have global operations and face risks related to health epidemics, including the novel coronavirus (“COVID-19”) global pandemic, that could materially impact our results of operations.
Our business could be materially adversely affected by the effects of a widespread outbreak of contagious disease, including the COVID-19 pandemic. Any new outbreak of contagious diseases and other adverse public health developments could have a material and adverse effect on our business operations. These could include disruptions or restrictions on our ability to travel or to distribute our products, as well as temporary closures of our facilities or the facilities of our suppliers or customers. Any disruption of our suppliers or customers, would likely impact our sales and operating results. In addition, a significant outbreak of contagious diseases in the human population could result in a widespread health crisis that could adversely affect the economies and financial markets of many countries, resulting in an economic downturn that could impact our operating results.
Our business may be further impacted by the COVID-19 global pandemic.
During 2020 and 2021, COVID-19 and its multiple variants spread throughout the world, resulting in widespread travel restrictions and extended shutdowns, occupancy limits or other restrictions of non-essential businesses, including manufacturing. The ultimate impact of the COVID-19 pandemic on our business is uncertain at this time and will depend on future developments, including the availability, efficacy and distribution of various vaccines, but further prolonged closures or restrictions throughout the world or the further rollback of reopening measures due to the resurgence of COVID-19 cases and continued decreases in the general level of economic activity may further disrupt our operations and the operations of our suppliers and customers. If significant portions of our workforce are unable to work effectively due to illness, quarantines, government actions or orders, facility closures or other reasons in connection with the COVID-19 pandemic, our operations will likely be impacted. We may be unable to manufacture sufficient products to perform fully on our contracts and some of our costs may not be fully recoverable or adequately covered by insurance. The severity and longevity of the COVID-19 pandemic may also cause customers to suspend their decisions on using our products and/or services, and give rise to significant changes in regional and global economic conditions that could interfere with the planning and construction of large desalination plants, which we rely on. Similarly, the COVID-19 pandemic has adversely affected and may further affect our supply base and increase the potential for one or more of our suppliers to experience financial distress or bankruptcy, which could impact our ability to fulfill orders on time or at anticipated cost. Additionally, it is unclear what longer term effects the virus will have on the global economy. Any of these factors could have a material adverse effect on our business, results of operations, cash flows and financial condition.
Energy Recovery, Inc. | 2021 Form 10-K Annual Report | 23
We depend on third party suppliers to deliver raw materials and components in accordance with our production schedule, and a shortage or disruption to our supply chain due to the impact of COVID-19 can disrupt our production of products.
The global spread of the COVID-19 pandemic has created uncertainty and economic disruption, including restrictions and delays in logistics, as well as labor shortages and inflation. Our products contain raw materials and components that we source globally from suppliers who, in turn, may source components from their suppliers. We and our suppliers may experience supply chain disruptions, our suppliers may experience an inability to manufacture or deliver products, or we and our suppliers may experience higher product costs, including inflation related increases. If there is a shortage or transportation delay of any materials or components in our supply chain, particularly from near sole source suppliers, and the raw materials and/or components cannot be readily sourced from a different supplier or at a cost we expect, the shortage or delay may disrupt the production of our products, and/or increase our costs, which could have a material adverse effect on our financial condition or results of operations. In addition, continued disruptions or delays in shipments whether due to port congestion, logistics carrier disruption, other shipping capacity constraints or other factors, may result in significantly increased inbound freight costs. Any significant increase in costs of these materials, components and inbound freight, could affect our operating results if we are unable to pass such increases to our customers. We will continue to evaluate the nature and extent of the impact of the COVID-19 pandemic on our business.
Risks Related to Information Technology
We may have risks associated with security of our information technology systems.
We make significant efforts to maintain the security and integrity of our information technology systems and data. Despite significant efforts to create security barriers to such systems, it is virtually impossible for us to entirely mitigate this risk. For example, on October 2, 2020, we detected a cyberattack on our network that temporarily disrupted access to some systems. In accordance with our ESG enterprise risk management policies related to financial and cybersecurity risks, we immediately took steps to isolate affected systems and contain the disruption to our information technology infrastructure. We implemented measures to prevent additional systems from being affected, including taking systems off-line as a precaution. We engaged third party information technology experts to restore and recover those affected systems to full functionality as quickly as possible. As it relates to the October 2, 2020 cyberattack, there had been no material impact to our operating activities or controls over financial reporting nor have we found any evidence to indicate that any data was compromised or stolen from the affected systems. We also do not believe that this incident has a long-term material adverse impact on our business, results of operations or financial condition. Although we have sufficient controls in place, we have implemented additional enhanced security features and monitoring procedures.
There is a risk of industrial espionage, cyberattacks, such as LOG4J, misuse or theft of information or assets, or damage to assets by people who may gain unauthorized access to our facilities, systems, or information. Such cybersecurity breaches, misuse, or other disruptions could lead to the disclosure of confidential information, improper usage and distribution of our IP, theft, manipulation and destruction of private and proprietary data, and production downtimes. Although we actively employ measures to prevent unauthorized access to our information systems, preventing unauthorized use or infringement of our rights is inherently difficult. These events could adversely affect our financial results and any legal action in connection with any such cybersecurity breach could be costly and time-consuming and may divert management’s attention and adversely affect the market’s perception of us and our products. In addition, we must frequently expand our internal information system to meet increasing demand in storage, computing and communication, which may result in increased costs. Our internal information system is expensive to expand and must be highly secure due to the sensitive nature of our customers’ information that we transmit. Building and managing the support necessary for our growth places significant demands on our management and resources. These demands may divert these resources from the continued growth of our business and implementation of our business strategy.
Our actual or perceived failure to adequately protect personal data could adversely affect our business, financial condition and results of operations.
A wide variety of provincial, state, national, foreign, and international laws and regulations apply to the collection, use, retention, protection, disclosure, transfer, and other processing of personal data. These privacy and data protection-related laws and regulations are evolving, with new or modified laws and regulations proposed and implemented frequently and existing laws and regulations subject to new or different interpretations. Further, our legal and regulatory obligations in foreign jurisdictions are subject to unexpected changes, including the potential for regulatory or other governmental entities to enact new or additional laws or regulations, to issue rulings that invalidate prior laws or regulations, or to increase penalties significantly. Compliance with these laws and regulations can be costly and can delay or impede the development and offering of new products and services.
Energy Recovery, Inc. | 2021 Form 10-K Annual Report | 24
For example, the General Data Protection Regulation, which became effective in May 2018, imposes more stringent data protection requirements, and provides for significantly greater penalties for noncompliance, than the European Union laws that previously applied. Additionally, California recently enacted legislation, the California Consumer Privacy Act, which became effective January 1, 2020. We may also be subject to additional obligations relating to personal data by contract that industry standards apply to our practices. Our actual or perceived failure to comply with applicable laws and regulations or other obligations to which we may be subject relating to personal data, or to protect personal data from unauthorized access, use, or other processing, could result in enforcement actions and regulatory investigations against us, claims for damages by customers and other affected individuals, fines, damage to our reputation, and loss of goodwill, any of which could have a material adverse effect on our operations, financial performance, and business. Further, evolving and changing definitions of personal data and personal information, including the classification of internet protocol addresses, machine identification information, location data, and other information, may limit or inhibit our ability to operate or expand our business, including limiting business relationships and partnerships that may involve the sharing or uses of data, and may require significant costs, resources, and efforts in order to comply.
Risks Related to Intellectual Property
If we are unable to protect our technology or enforce our intellectual property rights, our competitive position could be harmed, and we could be required to incur significant expenses to enforce our rights.
Our competitive position depends on our ability to establish and maintain proprietary rights in our technology and to protect our technology from copying by others. We rely on trade secret, patent, copyright, and trademark laws, as well as confidentiality agreements with employees and third parties, all of which may offer only limited protection. We hold a number of U.S. and counterpart international patents, and when their terms expire, we could become more vulnerable to increased competition. The protection of our IP in some countries may be limited. While we have expanded our portfolio of patent applications, we do not know whether any of our pending patent applications will result in the issuance of patents or whether the examination process will require us to narrow our claims, and even if patents are issued, they may be contested, circumvented, or invalidated. Moreover, while we believe our issued patents and patent pending applications are essential to the protection of our technology, the rights granted under any of our issued patents or patents that may be issued in the future may not provide us with proprietary protection or competitive advantages, and as with any technology, competitors may be able to develop similar or superior technologies now or in the future. In addition, our granted patents may not prevent misappropriation of our technology, particularly in foreign countries where IP laws may not protect our proprietary rights as fully as those in the U.S. This may render our patents impaired or useless and ultimately expose us to currently unanticipated competition. Protecting against the unauthorized use of our products, trademarks, and other proprietary rights is expensive, difficult, and in some cases, impossible. Litigation may be necessary in the future to enforce or defend our IP rights or to determine the validity and scope of the proprietary rights of others. IP litigation could result in substantial costs and diversion of management resources, either of which could harm our business.
Claims by others that we infringe their proprietary rights could harm our business.
Third parties could claim that our technology infringes their IP rights. In addition, we or our customers may be contacted by third parties suggesting that we obtain a license to certain of their IP rights that they may believe we are infringing. We expect that infringement claims against us may increase as the number of products and competitors in our market increases and overlaps occur. In addition, to the extent that we gain greater visibility, we believe that we will face a higher risk of being the subject of IP infringement claims. Any claim of infringement by a third party, even those without merit, could cause us to incur substantial costs defending against the claim and could distract management from our business. Furthermore, a party making such a claim, if successful, could secure a judgment that requires us to pay substantial damages. A judgment against us could also include an injunction or other court order that could prevent us from offering our products. In addition, we might be required to seek a license for the use of such IP, which may not be available on commercially reasonable terms, or at all. Alternatively, we may be required to develop non-infringing technology, which could require significant effort and expense and may ultimately not be successful. Any of these events could seriously harm our business. Third parties may also assert infringement claims against our customers. Because we generally indemnify our customers if our products infringe the proprietary rights of third parties, any such claims would require us to initiate or defend protracted and costly litigation on their behalf in one or more jurisdictions, regardless of the merits of these claims. If any of these claims succeed, we may be forced to pay damages on behalf of our customers.
Energy Recovery, Inc. | 2021 Form 10-K Annual Report | 25
Risks Related to Tax and Governmental Regulations
The enactment of legislation implementing changes in taxation of international business activities, the adoption of other corporate tax reform policies, or changes in tax legislation or policies could materially impact our financial position and results of operations.
Our future effective tax rates could be subject to volatility or adversely affected by changes in tax laws, regulations, accounting principles, or interpretations thereof. In addition, the U.S. Tax Cuts and Jobs Act (“Tax Act”) enacted in 2017, made significant changes to the taxation of U.S. business entities that may have a meaningful impact to our provision for income taxes. These changes included a reduction to the federal corporate income tax rate, the current taxation of certain foreign earnings, the imposition of base-erosion prevention measures which may limit the deduction of certain transfer pricing payments, and possible limitations on the deductibility of net interest expense or corporate debt obligations. The U.S. Department of the Treasury continues to issue regulations that affect various components of the Tax Act. Our future effective tax rate may be impacted by changes in interpretation of the regulations, as well as additional legislation and guidance regarding the Tax Act.
In addition, many countries are beginning to implement legislation and other guidance to align their international tax rules with the Organisation for Economic Co-operation’s Base Erosion and Profit Shifting recommendations and action plan that aim to standardize and modernize global corporate tax policy, including changes to cross-border tax, transfer-pricing documentation rules, and nexus-based tax incentive practices. As a result of the heightened scrutiny of corporate taxation policies, prior decisions by tax authorities regarding treatments and positions of corporate income taxes could be subject to enforcement activities, and legislative investigation and inquiry, which could also result in changes in tax policies or prior tax rulings. Any such changes in policies or rulings may also result in the taxes we previously paid being subject to change.
Due to the scale of our international business activities any substantial changes in international corporate tax policies, enforcement activities or legislative initiatives may materially and adversely affect our business, the amount of taxes we are required to pay and our financial condition and results of operations generally.
New or revised tax regulations could have a material effect on our financial statements
New tax laws or regulations could be enacted at any time, and existing tax laws or regulations could be interpreted, amended, or applied in a manner that has a material effect on us, which could materially impact our business and financial condition. As the enacted legislation includes provisions that would expire after certain periods of time, the fact that our business has the potential to change its operating situation, and the existence of potential changes by state tax authorities related to conformity with federal tax regulations, the possibility exists that the future benefit of the legislation could change. For more information related to the CARES Act, see Note 8, “Income Taxes,” of the Notes.
The U.S. Congress may make substantial changes to fiscal, regulation and other federal policies that may adversely affect our business, financial condition, operating results and cash flows.
Changes in general economic conditions in the U.S. or other regions could adversely affect our business. There have been and may be significant changes in, and uncertainty with respect to, legislation, regulation and government policy. While it is not possible to predict whether and when any such changes will occur, changes at the local, state or federal level could impact our business. Specific legislative and regulatory proposals that could have a material impact on us include, but are not limited to, modifications to international trade policy; public company reporting requirements; and environmental regulation.
Beginning in 2018, the U.S. imposed additional duties, ranging from 10% to 25%, on a variety of goods imported from China. Effective in September 2018, the Office of the U.S. Trade Representative (“USTR”) imposed tariffs of 10% on approximately $200 billion worth of goods imported from China (“List 3 products”), including categories of products we import from China and increased these tariffs to 25% effective in May 2019. In August 2019, the U.S. administration directed the USTR to increase tariffs on List 3 products from 25% to 30%, effective October 2019, which were subsequently delayed indefinitely. China responded to the multiple U.S. tariff lists by announcing several lists of products from the U.S. that are subject to additional tariffs upon import to China. The first round of Chinese retaliatory tariffs went into effect on July 6, 2018, and a second set was implemented on August 23, 2018. Our products are not impacted by these tariffs. A third group of items subject to 5% to 10% tariff went into effect on September 24, 2018, which includes our PX, Turbochargers and pump products.
Energy Recovery, Inc. | 2021 Form 10-K Annual Report | 26
We cannot predict what actions may ultimately be taken with respect to tariffs or trade relations between the U.S. and other countries, what products may be subject to such actions, or what actions may be taken by the other countries in retaliation. Accordingly, it is difficult to predict how such actions may impact our business, or the business of our customers. Our business operations, as well as the businesses of our customers on which we are substantially dependent, are located in various countries at risk for escalating trade disputes, including the U.S. and China. Any resulting trade wars could have a significant adverse effect on world trade and could adversely impact our revenues, gross margins and business operations.
Regulations related to conflict minerals could adversely impact our business.
The SEC adopted annual disclosure and reporting requirements for those companies who use conflict minerals mined from the Democratic Republic of Congo (also referred to as the “DRC”) and adjoining countries in their products. Based on our purchasing policy and supplier selection, it is considered unlikely that any conflict minerals are used in the manufacturing of our products. Nevertheless, we are continuing reasonable country of origin inquiry and have implemented a program of due diligence on the source and chain of custody for conflict minerals. There are costs associated with complying with these disclosure requirements, including loss of customers and potential changes to products, processes, or sources of supply. The implementation of these rules could adversely affect the sourcing, supply, and pricing of materials used in our products. As there may be only a limited number of suppliers offering “conflict free” minerals, we cannot be sure that we will be able to obtain necessary materials from such suppliers in sufficient quantities or at competitive prices. Also, we may face reputational challenges if we determine that certain of our products contain minerals not determined to be conflict-free or if we are unable to sufficiently verify the origins for all conflict minerals used in our products through the procedures we have implemented.
Risks Related to our Internal Control
Changes in U.S. generally accepted accounting principles (“GAAP”) could adversely affect our financial results and may require significant changes to our internal accounting systems and processes.
We prepare our consolidated financial statements in conformity with U.S. GAAP. These principles are subject to interpretation by the Financial Accounting Standards Board (“FASB”), the SEC and various bodies formed to interpret and create appropriate accounting principles and guidance. The FASB periodically issues new accounting standards on a variety of topics. For information regarding new accounting standards, please refer to Note 1, “Description of Business and Significant Accounting Policies – Recent Accounting Pronouncements,” of the Notes. These and other such standards generally result in different accounting principles, which may significantly impact our reported results or could result in variability of our financial results.
We are required to evaluate the effectiveness of our internal control over financial reporting and publicly disclose material weaknesses in our controls. Any adverse results from such evaluation may adversely affect investor perception, and our stock price.
Section 404 of the Sarbanes-Oxley Act of 2002 requires our management to assess the effectiveness of our internal control over financial reporting and to disclose in our filing if such controls were unable to provide assurance that a material error would be prevented or detected in a timely manner. We have an ongoing program to review the design of our internal controls framework in keeping with changes in business needs, implement necessary changes to our controls design and test the system and process controls necessary to comply with these requirements. If in the future, our internal controls over financial reporting are determined to be not effective resulting in a material weakness or significant deficiency, investor perceptions regarding the reliability of our financial statements may be adversely affected which could cause a decline in the market price of our stock and otherwise negatively affect our liquidity and financial condition.
Risks Related to our Common Stock
Insiders and principal stockholders will likely have significant influence over matters requiring stockholder approval.
Our directors, executive officers, and other principal stockholders beneficially own, in the aggregate, a substantial amount of our outstanding common stock. These stockholders could likely have significant influence over all matters requiring stockholder approval, including the election of directors and approval of significant corporate transactions such as a merger or other sale of our company or our company’s assets.
Energy Recovery, Inc. | 2021 Form 10-K Annual Report | 27
The market price of our common stock may continue to be volatile.
The market price of our common stock has been, and is likely to continue to be, volatile and subject to fluctuations. Changes in the stock market generally, as it concerns our industry, as well as geopolitical, economic, and business factors unrelated to us, may also affect our stock price. Significant declines in the market price of our common stock or failure of the market price to increase could harm our ability to recruit and retain key employees, reduce our access to debt or equity capital, and otherwise harm our business or financial condition. In addition, we may not be able to use our common stock effectively as consideration in connection with any future acquisitions.
Anti-takeover provisions in our charter documents and under Delaware law could discourage, delay, or prevent a change in control of our company and may affect the trading price of our common stock.
Provisions in our amended and restated certificate of incorporation and bylaws may have the effect of delaying or preventing a change of control or changes in our management. Our amended and restated certificate of incorporation and amended and restated bylaws include provisions that:
•authorize our Board of Directors to issue, without further action by the stockholders, up to 10,000,000 shares of undesignated preferred stock;
•require that any action to be taken by our stockholders be effected at a duly called annual or special meeting and not by written consent;
•specify that special meetings of our stockholders can be called only by our Board of Directors, the chairman of the board, the chief executive officer, or the president;
•establish an advance notice procedure for stockholder approvals to be brought before an annual meeting of our stockholders, including proposed nominations of persons for election to our Board of Directors;
•provide that our directors may be removed only for cause;
•provide that vacancies on our Board of Directors may be filled only by a majority vote of directors then in office, even though less than a quorum;
•specify that no stockholder is permitted to cumulate votes at any election of directors; and
•require a super-majority of votes to amend certain of the above-mentioned provisions.
In addition, we are subject to the provisions of Section 203 of the Delaware General Corporation Law regulating corporate takeovers. Section 203 generally prohibits us from engaging in a business combination with an interested stockholder subject to certain exceptions.
Our business could be negatively affected as a result of actions of activist shareholders, and such activism could impact the trading value of our securities.
In recent years, shareholder activists have become involved in numerous public companies. Shareholder activists frequently propose to involve themselves in the governance, strategic direction and operations of the company. Such proposals may disrupt our business and divert the attention of our Board of Directors, management and employees, and any perceived uncertainties as to our future direction resulting from such a situation could result in the loss of potential business opportunities, interfere with our ability to execute our strategic plan, be exploited by our competitors, cause concern to our current or potential customers, and make it more difficult to attract and retain qualified personnel and business partners, all of which could adversely affect our business. A proxy contest for the election of directors at our annual meeting could also require us to incur significant legal fees and proxy solicitation expenses. In addition, actions of activist shareholders may cause significant fluctuations in our stock price based on temporary or speculative market perceptions or other factors that do not necessarily reflect the underlying fundamentals and prospects of our business.
Energy Recovery, Inc. | 2021 Form 10-K Annual Report | 28
Our share repurchase program may not be the most effective use of our capital and, if shares are repurchased under the program, could increase the volatility of the price of our common stock.
Periodically, our Board of Directors approves programs to repurchase our common stock. Considered in this decision is the effect any such repurchases may have on our cash balances and needs, cash flow, and short and long-term borrowing. Share repurchases under the program may be made, from time-to-time, at the Board of Director’s discretion through open market purchases or privately negotiated transactions in accordance with applicable federal securities laws. The share repurchase program is subject to a periodic review by the Board of Directors and may be suspended periodically or discontinued at any time. We plan to fund repurchases from our existing cash balance. There can be no assurance that we will buy shares of our common stock under the share repurchase program or that any repurchases will have a positive impact on our stock price or earnings per share. We could discontinue or decrease our share repurchases due to unfavorable market conditions, the market price of our common stock, the nature of other investment opportunities presented to us from time to time that would require significant cash outlays, and the availability of funds necessary to continue purchasing shares.
Our shareholders may experience future dilution as a result of future equity offerings.
In the future, we may offer additional shares of our common stock or other securities convertible into or exchangeable for our common stock in order to raise additional capital. We cannot assure our shareholders that we will be able to sell shares or other securities in any other offering at a price per share that is equal to or greater than the price per share our shareholders paid for our shares. Investors purchasing shares or other securities in the future could have rights, preferences or privileges senior to those of our shareholders and our shareholders may experience dilution. Our shareholders may incur additional dilution upon the exercise of any outstanding stock options or warrants, the issuance of shares of restricted stock, the vesting of restricted stock units, or the issuance, vesting or exercise of other equity awards.
We do not intend to pay cash dividends in the foreseeable future and, consequently, our shareholders’ ability to achieve a return on their investment will depend on the appreciation in the price of our common stock.
We have never declared or paid cash dividends on our common stock and we do not intend at this time to pay any cash dividends on our common stock in the foreseeable future. We currently expect to utilize any future earnings for use in the operation and expansion of our business. In addition, the terms of our revolving credit facility restrict our ability to pay dividends and any future credit facilities, loan agreements, debt instruments or other agreements may further restrict our ability to pay dividends. Payments of future dividends, if any, will be at the discretion of our Board of Directors after taking into account various factors, including our business, results of operations and financial condition, current and anticipated cash needs, plans for expansion and any legal or contractual limitations on our ability to pay dividends. As a result, capital appreciation, if any, of our common stock will be our shareholders’ sole source of potential gain for the foreseeable future.
Item 1B — Unresolved Staff Comments
None.
Energy Recovery, Inc. | 2021 Form 10-K Annual Report | 29
Item 2 — Properties
We lease approximately 171,000 square feet (“ft2”) of space located in San Leandro, California for product manufacturing, research and development, and executive headquarters under a lease that expires on December 31, 2028.
On January 10, 2019, we entered into an industrial lease agreement for property located in Katy, Texas, which commenced on January 1, 2020 and expires in 2029. This new lease includes an additional 25,200 ft2 of office, manufacturing and warehouse space and approximately 4.5 acres of land, to test the VorTeq technology at scale and in real world conditions on a regular, uninterrupted basis, as well as testing and manufacturing new applications for our pressure exchanger technology.
On February 10, 2020, we entered into a lease agreement for an additional manufacturing and warehousing space located in Tracy, California. This new lease commenced on March 1, 2020 and expires in 2030. This manufacturing and warehousing space is approximately 54,429 ft2 and supplements the existing manufacturing, warehousing and distribution of our ERDs.
Additionally, we lease offices located in Dubai, United Arab Emirates; and Shanghai, Peoples Republic of China. We believe that these facilities will be adequate for our purposes for the foreseeable future.
Item 3 — Legal Proceedings
See Note 7, “Commitments and Contingencies – Litigation” of the Notes which is incorporated by reference into this Item 3, for a description of the lawsuits pending, if any, against us.
Item 4 — Mine Safety Disclosures
Not applicable.
Energy Recovery, Inc. | 2021 Form 10-K Annual Report | 30
PART II
Item 5 — Market for Registrant’s Common Equity, Related Stockholder Matters and Issuer Purchases of Equity Securities
Market Information
Our common stock is listed on The Nasdaq Global Select Market under the symbol “ERII.”
Stockholders
As of December 31, 2021, there were approximately 17 stockholders of record of our common stock as reported by our transfer agent, one of which is Cede & Co., a nominee for Depository Trust Company (“DTC”). All of the shares of common stock held by brokerage firms, banks, and other financial institutions as nominees for beneficial owners are deposited into participant accounts at DTC and are therefore considered to be held of record by Cede & Co., as one stockholder.
Dividend Policy
We have never declared or paid any dividends on our common stock, and we do not currently intend to pay any dividends on our common stock for the foreseeable future. Any future determination to pay dividends on our common stock will be, subject to applicable law, at the discretion of our Board of Directors, and will depend upon, among other factors, our results of operations, financial condition, capital requirements, and contractual restrictions in loan or other agreements.
Sales of Unregistered Securities
None.
Stock Repurchase Program
Our Board of Directors has authorized various share repurchase programs since 2012. Since the initial authorization of the share repurchase programs, we have spent an aggregate $53.8 million, including commissions, to repurchase 6,721,153 shares. On March 9, 2021, our Board of Directors authorized a share repurchase program (the “March 2021 Authorization”) under which we, at the discretion of management, may repurchase up to $50.0 million in aggregate cost of our outstanding common stock. Under the newly authorized repurchase program, purchases of shares of common stock may be made from time to time in the open market, or in privately negotiated transactions, in compliance with applicable state and federal securities laws. The timing and amounts of any purchases will be based on market conditions and other factors including price, regulatory requirements, and capital availability. The share buyback program does not obligate us to acquire any specific number of shares in any period, and may be expanded, extended, modified or discontinued at any time without prior notice.
| | | | | | | | | | | | | | | | | | | | | | | | | | | | | |
| Period | | Total Number of Shares Purchased | | Average Price Paid per Share(1) | | Total Number of Shares Purchased as Part of Publically Announced Program | | | Maximum Number of Shares or Approximate Dollar Value(2) That May Yet to be Purchased Under the Program |
| | | | | | | | | (In thousands) |
| October 1 – October 31, 2021 | | 217,270 | | | $19.43 | | 1,169,936 | | | $28,618 |
| November 1 – November 30, 2021 | | 14,173 | | | 20.69 | | 1,184,109 | | | 28,324 |
| December 1 – December 31, 2021 | | 81,109 | | | 20.57 | | 1,265,218 | | | 26,654 |
| | | | | | | | | |
(1) Excluding commissions
(2) Including commissions
Energy Recovery, Inc. | 2021 Form 10-K Annual Report | 31
Stock Performance Graph
The following graph shows the cumulative total stockholder return of an investment of $100 on December 31, 2016 in (i) our common stock, (ii) the NASDAQ Composite Index, (iii) common stock of a selected group of peer issuers (“Former Peer Group”), (iv) and a new peer group for the current fiscal year (“New Peer Group”). Cumulative total return assumes the reinvestment of dividends, although dividends have never been declared on our stock, and is based on the returns of the component companies weighted according to their capitalization as of the end of each annual period. For each reported year, the reported dates are the last trading dates of our annual year.
The NASDAQ Composite Index tracks the aggregate total return performance of equity securities traded on the NASDAQ. The Former Peer Group tracks the weighted average total return performance of equity securities of seven companies in our industry: Consolidated Water Co. Ltd.; Flowserve Corp.; Hyflux Ltd.; Kurita Water Industries Ltd.; Pentair plc; Tetra Tech, Inc.; and The Gorman-Rupp Company. The return of each component issuer of the Former Peer Group is weighted according to the respective issuer’s stock market capitalization at the end of each period for which a return is indicated. The New Peer Group tracks the weighted average total return performance of equity securities of nine companies that management believes Energy Recovery, Inc. is closely aligned during the years presented. As we evolve and grow into new industries, management expects to expand or rebalance the companies within this peer group. The companies within the New Peer Group are: Badger Meter, Inc.; Evoqua Water Technologies Corp.; Flowserve Corp; Franklin Electronic Co., Inc.; The Gorman-Rupp Company; Itron, Inc.; Kurita Water Industries Ltd.; Pentair plc; and Primo Water Corp. The return of each component issuer of the New Peer Group is weighted according to the respective issuer’s stock market capitalization at the end of each period for which a return is indicated. Our stock price performance shown in the graph below is not indicative of future stock price performance.
The following graph and its related information is not “soliciting material,” is not deemed “filed” with the Securities and Exchange Commission, and is not to be incorporated by reference into any filing of the Company under the Securities Act of 1933, as amended or the Securities Exchange Act of 1934, as amended, whether made before or after the date hereof and irrespective of any general incorporation language contained in such filing.
COMPARISON OF FIVE-YEAR CUMULATIVE TOTAL RETURN
Among Energy Recovery, Inc., The NASDAQ Composite Index,
Former Peer Group, and New Peer Group
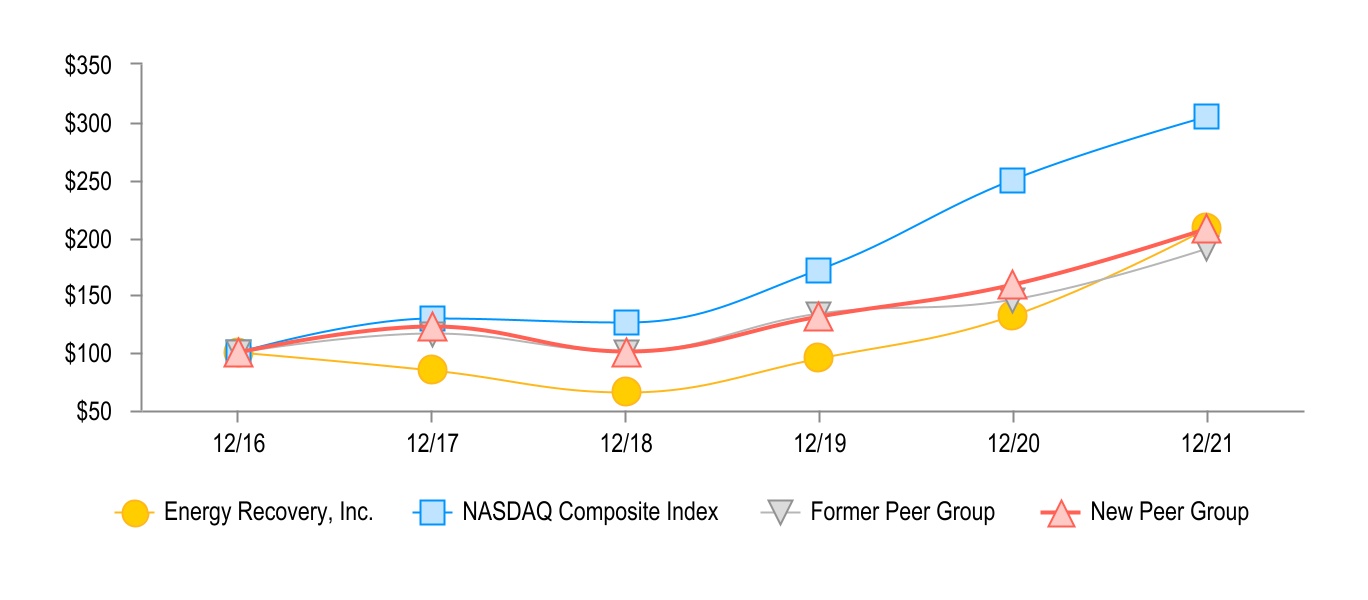
| | | | | | | | | | | | | | | | | | | | | | | | | | | | | | | | | | | |
| | December 31,
2016 | | December 31,
2017 | | December 31,
2018 | | December 31,
2019 | | December 31,
2020 | | December 31,
2021 |
| Energy Recovery, Inc. | $ | 100.00 | | | $ | 84.54 | | | $ | 65.02 | | | $ | 94.59 | | | $ | 131.79 | | | $ | 207.63 | |
| NASDAQ Composite Index | 100.00 | | | 129.64 | | | 125.96 | | | 172.17 | | | 249.51 | | | 304.85 | |
| Former Peer Group | 100.00 | | | 116.59 | | | 100.58 | | | 133.99 | | | 145.82 | | | 190.38 | |
| | | | | | | | | | | |
| New Peer Group | 100.00 | | | 122.43 | | | 100.60 | | | 131.03 | | | 158.90 | | | 207.25 | |
Energy Recovery, Inc. | 2021 Form 10-K Annual Report | 32
Item 6 — [Reserved]
Item 7 — Management’s Discussion and Analysis of Financial Condition and Results of Operations
The following Management Discussion and Analysis of Financial Condition and Results of Operations is intended to help the reader understand our results of operations and financial condition. It should be read in conjunction with the Consolidated Financial Statements and related Notes included in Part II, Item 8, “Financial Statements and Supplementary Data,” in this Annual Report on Form 10-K.
Overview
Our reportable operating segments consist of the water and emerging technologies segments. These segments are based on the industries in which the technology solutions are sold, the type of ERD or other technology sold and the related solution and service or, in the case of emerging technologies, where revenues from new and/or potential devices utilizing our pressure exchanger technology can be brought to market. Other factors for determining the reportable operating segments include the manner in which management evaluates the performance of the Company combined with the nature of the individual business activities. In addition, our corporate operating expenses include expenditures in support of the water and emerging technologies segments, as well as R&D expenditures applicable to potential future industry verticals, or enabling technologies that could benefit either or both existing business units.
Highlights
Despite the worldwide challenges related to COVID-19, during the year:
•New large greenfield plant installations and brownfield retrofits, and plant level resupply of critical components drove product revenues to exceed $100 million.
•Announced the first contract of our PX G1300 to a U.S. supermarket chain.
•Announced contracts to supply the Ultra PX to support the IWW treatment operations of two Chinese lithium-ion battery manufacturing facilities, as well as contracts with chemical manufacturing, landfill leachate and natural gas plants in China.
•Announced our joint-marketing effort with a global leader in purification and specialty-separation technologies, to spread the knowledge of advanced solutions improving the efficiency of many IWW treatment systems and the benefits of pairing our Ultra PX with third-party membranes in IWW treatment systems.
•Entered into a new $50 million credit agreement with JPMorgan Chase Bank, N.A. in December 2021 to replace our existing $16 million loan and pledge agreement with Citibank, N.A. This new credit agreement will provide us with additional capital for growth and expansion into emerging markets utilizing our pressure exchanger technology.
COVID-19 Pandemic
In March 2020, the World Health Organization declared the outbreak of a novel coronavirus (“COVID-19”), a pandemic which has resulted in authorities across the globe implementing numerous measures to contain the virus. In response to measures taken by federal, state and local governments, we have instituted the government minimum masking standards as well as provided enhanced safety measures above and beyond the government minimum, including shift configurations that ensure social distancing between workers, personal safety equipment for each worker, such as gloves, cleanings between shifts, weekly testing of employees and vendors working on site, and limiting office activities to essential personnel. In addition, we implemented, where feasible, a work-at-home policy, to allow for continued operation of all support functions. These enhanced safety measures allow us to help contain the spread of COVID-19 and to ensure the health and safety of our employees.
Due to uncertainties, we are unable to accurately predict the full impact that the COVID-19 pandemic and its multiple variants will have on our long-term financial condition, results of operations, liquidity and cash flows. Based on current projections, which are subject to numerous uncertainties, including the duration and severity of the COVID-19 pandemic and containment measures and the effect of these on the industries in which we compete, we believe our cash on hand and marketable securities, as well as our ongoing cash generated from operations, will be sufficient to cover our capital requirements for the next 12 months from the issuance of this annual report.
For a discussion of the key trends and uncertainties that have affected our revenues, income and liquidity, see Part I, Item 1A, “Risk Factors”, Part II, Item 7, “Management’s Discussion and Analysis – Results of Operations,” and Part II, Item 7, “Management’s Discussion and Analysis – Liquidity and Capital Resources," of this Annual Report on Form 10-K.
Energy Recovery, Inc. | 2021 Form 10-K Annual Report | 33
Results of Operations
A discussion regarding our financial condition and results of operations for the year ended December 31, 2020, compared to the year ended December 31, 2019, can be found under Item 7 in our Annual Report on Form 10-K for the year ended December 31, 2020, filed with the SEC on March 12, 2021, which is available free of charge on the SEC’s website at http://www.sec.gov and at our investor relations website (https://ir.energyrecovery.com).
Total Revenue
| | | | | | | | | | | | | | | | | | | | | | | | | | | | | | | | | | | |
| | Years Ended December 31, | | | | |
| | 2021 | | 2020 | | | | |
| $ | | % of Total Revenue | | $ | | % of Total Revenue | | Change |
| (In thousands, except percentages) |
| | | | | | | | | | | |
| | | | | | | | | | | |
| | | | | | | | | | | |
| Product revenue | $ | 103,904 | | | 100 | % | | $ | 92,091 | | | 77 | % | | $ | 11,813 | | | 13 | % |
| License and development revenue | — | | | — | % | | 26,895 | | | 23 | % | | (26,895) | | | (100 | %) |
| Total revenue | $ | 103,904 | | | 100 | % | | $ | 118,986 | | | 100 | % | | $ | (15,082) | | | (13 | %) |
Product Revenue
Product revenues by channel customers are presented in the following table.
| | | | | | | | | | | | | | | | | | | | | | | | | | | | | | | | | | | |
| Years Ended December 31, | | | | |
| 2021 | | 2020 | | | | |
| $ | | % of Product Revenue | | $ | | % of Product Revenue | | Change |
| (In thousands, except percentages) |
| | | | | | | | | | | |
| Megaproject | $ | 75,391 | | | 73 | % | | $ | 66,763 | | | 73 | % | | $ | 8,628 | | | 13 | % |
| Original equipment manufacturer | 17,604 | | | 17 | % | | 15,834 | | | 17 | % | | 1,770 | | | 11 | % |
| Aftermarket | 10,909 | | | 10 | % | | 9,494 | | | 10 | % | | 1,415 | | | 15 | % |
| | | | | | | | | | | |
| Total product revenue | $ | 103,904 | | | 100 | % | | $ | 92,091 | | | 100 | % | | $ | 11,813 | | | 13 | % |
| | | | | | | | | | | |
| | | | | | | | | | | |
The MPD channel continues to be the main driver of our long-term growth as revenue from this channel benefits from the higher quantity of larger projects as well as long project cycles. Comparative differences over the prior year’s revenue are subject to timing of delivery of PXs, which is dependent on the MPD project shipment cycle.
The OEM channel, where we sell into a number of industries, including tourism and hospitality, and which contains projects of shorter duration, saw a continued increase since the onset of the COVID-19 pandemic. The increases in OEM channel revenues over the prior year were due primarily to certain new large greenfield plant installations and brownfield retrofits, which include upgrades to existing operations leveraging our pressure exchanger technology and ancillary equipment. In addition, we have started to recognize revenues from IWW. In fiscal year 2020, OEM channel revenues were negatively affected by delayed new plant construction related to the COVID-19 pandemic.
The AM channel revenues generally fluctuate from year-to-year depending on support and services rendered to our customers; however, revenue in 2021 from this channel has been higher year over year due to our large installed customer base, which we believe is a result of our customers consuming their existing spare parts inventory and strategically increasing their stock of critical components in advance of greater expected water needs in the near future. In addition, in fiscal year 2020, AM channel revenues were affected by the COVID-19 pandemic as budgets tightened and companies braced for the unknown.
License and Development Revenue
The change in license and development revenue was due to the termination of the 2015 license agreement (the “VorTeq License Agreement”) between us and Schlumberger Technology Corporation (“Schlumberger”), with an effective date of June 1, 2020. As there were no future performance obligations to be recognized under the VorTeq License Agreement after the effective date, we recognized in full the remaining deferred revenue balance of $24.4 million in the second quarter of fiscal year 2020. In addition, no future license and development revenue was recognized under the VorTeq License Agreement after the second quarter of fiscal year 2020.
Energy Recovery, Inc. | 2021 Form 10-K Annual Report | 34
Concentration of Revenue
Product revenue attributable to domestic and international sales as a percentage of total product revenue is presented in the following table.
| | | | | | | | | | | | | | | | | |
| | | | Years Ended December 31, |
| | | | | | 2021 | | 2020 | | |
| | | | | | | | | |
| | | | | | | | | |
| | | | | | | | | |
| | | | | | | | | |
| | | | | | | | | |
| | | | | | | | | |
| United States | | | | | 1% | | 2% | | |
| International | | | | | 99% | | 98% | | |
| Total product revenue | | | | | 100% | | 100% | | |
| | | | | | | | | |
| | | | | | | | | |
| | | | | | | | | |
| | | | | | | | | |
| | | | | | | | | |
| | | | | | | | | |
| | | | | | | | | |
| | | | | | | | | |
| | | | | | | | | |
| | | | | | | | | |
| | | | | | | | | |
| | | | | | | | | |
| | | | | | | | | |
| | | | | | | | | |
| | | | | | | | | |
| | | | | | | | | |
| | | | | | | | | |
| | | | | | | | | |
| | | | | | | | | |
The following table presents customers accounting for 10% or more of our product revenue by segment. Although certain customers might account for greater than 10% of our product revenue at any one point in time, the concentration of product revenue between a limited number of large MPD customers shifts regularly, depending on timing of MPD shipments. The percentages by customer reflect specific relationships or contracts that would concentrate our product revenue for the periods presented and does not indicate a trend specific to any one customer.
| | | | | | | | | | | | | | | | | | | | | | | |
| | | | | Years Ended December 31, |
| | Segment | | | | | | 2021 | | 2020 | | |
| Customer A | Water | | | | | | 21% | | 27% | | |
| Customer B | Water | | | | | | 16% | | ** | | |
| Customer C | Water | | | | | | 11% | | ** | | |
| Customer D | Water | | | | | | 10% | | 23% | | |
| | | | | | | | | | | |
| | | | | | | | | | | |
| | | | | | | | | | | |
| | | | | | | | | | | |
| | | | | | | | | | | |
| | | | | | | | | | | |
| | | | | | | | | | | |
| | | | | | | | | | | |
| | | | | | | | | | | |
| | | | | | | | | | | |
| | | | | | | | | | | |
| | | | | | | | | | | |
| | | | | | | | | | | |
| | | | | | | | | | | |
** Zero or less than 10%.
Product Gross Profit and Gross Margin
| | | | | | | | | | | | | | | | | | | | | | | | | | | | | | | | | | | | | |
| | Years Ended December 31, | | | | | | |
| | 2021 | | 2020 | | | | | | |
| $ | | Gross Margin | | $ | | Gross Margin | | Change in Product Gross Profit |
| (In thousands, except percentages) | | |
| | | | | | | | | | | | | |
| | | | | | | | | | | | | |
| Product gross profit and gross margin | $ | 71,234 | | | 68.6 | % | | $ | 63,842 | | | 69.3 | % | | $ | 7,392 | | | 11.6 | % | | |
| | | | | | | | | | | | | |
| | | | | | | | | | | | | |
The increase in product gross profit for the year ended December 31, 2021, as compared to the same period in the prior year, was due primarily to higher revenues related to increased units of PXs, pumps and Turbochargers sold, partially offset by a decrease in product gross margin. The lower gross margin was due primarily to rising labor, overhead costs and product mix, partially offset by lower COVID-19 pandemic costs.
Energy Recovery, Inc. | 2021 Form 10-K Annual Report | 35
Operating Expenses
Total Operating Expenses
| | | | | | | | | | | | | | | | | | | | | | | | | | | |
| | Years Ended December 31, | | | | |
| | 2021 | | 2020 | | | | |
| $ | | | | $ | | | | Change |
| (In thousands, except percentages) |
| | | | | | | | | | | |
| | | | | | | | | | | |
| General and administrative | $ | 25,162 | | | | | $ | 25,519 | | | | | $ | (357) | | | (1 | %) |
| Sales and marketing | 12,160 | | | | | 8,127 | | | | | 4,033 | | | 50 | % |
| Research and development | 20,069 | | | | | 23,449 | | | | | (3,380) | | | (14 | %) |
| Amortization of intangible assets | 12 | | | | | 16 | | | | | (4) | | | (25 | %) |
| | | | | | | | | | | |
| Impairment of long-lived assets | — | | | | | 2,332 | | | | | (2,332) | | | (100 | %) |
| | | | | | | | | | | |
| | | | | | | | | | | |
| Total operating expenses | $ | 57,403 | | | | | $ | 59,443 | | | | | $ | (2,040) | | | (3 | %) |
| | | | | | | | | | | |
General and Administrative Expenses. The decrease in G&A expenses was due primarily to lower professional service and employee compensation costs, partially offset by higher software licensing and support costs, depreciation expense, and legal fees.
Sales and Marketing Expenses. The increase in S&M expenses was due primarily to higher employee-related costs of $2.4 million and higher marketing costs of $0.9 million, including trade shows and marketing materials, and an increase in commission costs of $0.5 million related to an increase in product sales. The increased employee-related costs were due primarily to higher employee compensation costs, share-based compensation expense, incentive compensation expenses, and other employee-related expenses related to an increase in headcount.
Research and Development Expenses. The decrease in R&D expenses was due primarily to reductions in spend to develop the VorTeq technology, which decreased beginning in the second half of 2020. The lower VorTeq-related expenditures in 2021 were partially offset by increased costs to support other incubation initiatives.
Amortization of Intangible Assets. Amortization of intangible assets was comparable to the prior year.
Impairment of Long-lived Assets. There was no impairment of long-lived assets in 2021. During the second quarter of 2020, we conducted an analysis on certain VorTeq long-lived assets that were directly related to obligations under the VorTeq License Agreement and determined that certain of those assets were impaired. The net carrying value of the impaired VorTeq-related machinery and equipment of $2.3 million was recognized in the year ended December 31, 2020.
Energy Recovery, Inc. | 2021 Form 10-K Annual Report | 36
Segment and Corporate Operating Expenses
Expense activities that are included in our Water and Emerging Technologies segments and corporate operating expenses are presented below. See Note 11, “Segment Reporting,” of the Notes for further discussion regarding our segments.
| | | | | | | | | | | | | | | | | | | | | | | | | | | | | | | | | | | | | | | | | | | | | | | |
| Year Ended December 31, 2021 | | Year Ended December 31, 2020 (Recast) |
| Water | | Emerging Technologies | | Corporate | | Total | | Water | | Emerging Technologies | | Corporate | | Total |
| (In thousands) |
| | | | | | | | | | | | | | | |
| General and administrative | $ | 6,330 | | | $ | 5,162 | | | $ | 13,670 | | | $ | 25,162 | | | $ | 9,172 | | | $ | 5,410 | | | $ | 10,937 | | | $ | 25,519 | |
| Sales and marketing | 9,559 | | | 937 | | | 1,664 | | | 12,160 | | | 5,958 | | | 1,192 | | | 977 | | | 8,127 | |
| Research and development | 2,589 | | | 17,480 | | | — | | | 20,069 | | | 2,973 | | | 20,476 | | | — | | | 23,449 | |
| Amortization of intangible assets | 12 | | | — | | | — | | | 12 | | | 16 | | | — | | | — | | | 16 | |
| Impairment of long-lived assets | — | | | — | | | — | | | — | | | — | | | 2,332 | | | — | | | 2,332 | |
| Total operating expenses | $ | 18,490 | | | $ | 23,579 | | | $ | 15,334 | | | $ | 57,403 | | | $ | 18,119 | | | $ | 29,410 | | | $ | 11,914 | | | $ | 59,443 | |
| | | | | | | | | | | | | | | |
| | | | | | | | | | | | | | | |
| | | | | | | | | | | | | | | |
Water Segment. The increase in the Water segment operating expenses of $0.4 million was due primarily to an increase in employee costs, partially offset by lower consultant costs.
Emerging Technologies Segment. The decrease of the Emerging Technologies segment operating expenses of $5.8 million was due primarily to reduced VorTeq-related expense of $6.7 million as well as the impairment of certain VorTeq-related equipment in the second quarter of fiscal year 2020, which was partially offset by an increase of expenditures for development of industrial and commercial refrigeration of $3.2 million, including higher employee-related costs. Total VorTeq-related expense was $13.8 million during 2021, including R&D expenditures of $10.8 million.
Corporate Operating Expenses. The increase of the corporate operating expenses of $3.4 million was due primarily to an increase in employee-related costs, such as share-based compensation expense and compensation costs, professional services, legal costs and public relations costs.
Other Income, Net
| | | | | | | | | | | | | | | | | | | | | | | | | | | | | | | | | | | |
| | | | | | | | Years Ended December 31, | | | | |
| | | | | | | | 2021 | | 2020 | | Change |
| | | | | | | | | | | | | | | | | | | | | | | |
| | | | | | | | | | | | | (In thousands) |
| | | | | | | | | | | | | | | | | | | | | | | |
| | | | | | | | | | | | | | | | | | | | | | | |
| | | | | | | | | | | | | | | | | | | | | | | |
| Interest income | | | | | | | | | | | | | $ | 204 | | | | | $ | 913 | | | | | $ | (709) | | | |
| | | | | | | | | | | | | | | | | | | | | | | |
| Other non-operating expense, net | | | | | | | | | | | | | (31) | | | | | (74) | | | | | 43 | | | |
| Total other income, net | | | | | | | | | | | | | $ | 173 | | | | | $ | 839 | | | | | $ | (666) | | | |
| | | | | | | | | | | | | | | | | | | | | | | |
| | | | | | | | | | | | | | | | | | | | | | | |
| | | | | | | | | | | | | | | | | | | | | | | |
| | | | | | | | | | | | | | | | | | | | | | | |
| | | | | | | | | | | | | | | | | | | | | | | |
Total other income, net decreased in the year ended December 31, 2021, compared to the year ended December 31, 2020, due primarily to lower interest income. Our investment strategy, starting in the first quarter of fiscal year 2020 through the second quarter of 2021, shifted from investing in debt securities to holding cash in money market funds due primarily to the uncertainty caused by the COVID-19 pandemic. Starting in the third quarter of 2021, we began shifting our investment strategy from holding cash in money market funds back to investing in debt securities due to the strengthening of the economic environment.
Energy Recovery, Inc. | 2021 Form 10-K Annual Report | 37
Income Taxes
| | | | | | | | | | | | | | | | | | | | | | | | | | | |
| | | | Years Ended December 31, | | | | |
| | | | | | | | 2021 | | 2020 | | Change |
| | | | | | | | | (In thousands, except percentages) |
| (Benefit from) provision for income taxes | | | | | | | | | $ | (265) | | | $ | 5,746 | | | $ | (6,011) | | | |
| Effective tax rate | | | | | | | | | (2%) | | 18% | | | | |
| | | | | | | | | | | | | | | |
| | | | | | | | | | | | | | | |
The benefit from income taxes in 2021, as compared to the provision for income taxed in 2020, was due primarily to lower income before taxes related to termination of the VorTeq License Agreement.
The fiscal year 2021 effective tax rate included a benefit of $2.9 million related to tax deductions from stock-based compensation related windfalls and a $1.0 million tax benefit related to U.S. federal R&D credits.
The fiscal year 2020 effective tax rate included a deferred tax benefit of $1.0 million related to an increase in prior year U.S. federal R&D credits and a tax benefit of $0.5 million related to tax deductions from stock-based compensation, partially offset by deferred tax expense of $0.4 million due primarily to a remeasurement of our state deferred tax assets due to an adjustment to our estimated blended state effective tax rate.
See Note 8, “Income Taxes,” of the Notes for further discussion regarding further information related to our tax rate reconciliation.
Liquidity and Capital Resources
Overview
From time to time, management and our Board of Directors review our liquidity and future cash needs and may make a decision on (1) the return of capital to our shareholders through a share repurchase program or dividend payout; or (2) seek additional debt or equity financing. As of December 31, 2021, our principal sources of liquidity consisted of (i) unrestricted cash and cash equivalents of $74.4 million; (ii) investment-grade short-term and long-term high-quality marketable debt instruments of $33.6 million that are primarily invested in U.S. treasury securities, and corporate notes and bonds; and (iii) accounts receivable, net of allowances, of $20.6 million. As of December 31, 2021, there were unrestricted cash and cash equivalents of $1.0 million held outside the U.S. We invest cash not needed for current operations predominantly in high-quality, investment-grade, marketable debt instruments with the intent to make such funds available for operating purposes as needed. Although these securities are available for sale, we generally hold these securities to maturity, and therefore, do not currently see a need to trade these securities in order to support our liquidity needs in the foreseeable future. The risk of this portfolio to us is in the ability of the underlying companies to cover their obligations at maturity, not in our ability to trade these securities at a profit. Based on current projections, we believe existing cash balances and future cash inflows from this portfolio will meet our liquidity needs for at least the next 12 months.
Credit Arrangements
We entered into a credit agreement with JPMorgan Chase Bank, N.A. (“JPMC”) on December 22, 2021 (“Credit Agreement”) to provide us with additional capital to fuel our growth and expansion into emerging markets utilizing our pressure exchanger technology. The Credit Agreement, which will expire on December 21, 2026, provides a committed revolving credit line of $50.0 million. The Credit Agreement includes both a revolving loan and a letters of credit (“LCs”) component. Upon entering into the Credit Agreement with JPMC, we terminated the existing Loan and Pledge Agreement dated January 27, 2017 with Citibank, N.A., and all of the existing stand-by letters of credit (“SBLCs”) under the Loan and Pledge Agreement were covered as a LC issuance under the Credit Agreement. As of December 31, 2021 we were in compliance with all covenants under the Credit Agreement. In addition, as of December 31, 2021 there were no revolving loan amounts outstanding and $14.0 million of outstanding LCs with a weighted average remaining life of 12 months. See Note 6, “Lines of Credit,” of the Notes for further discussion related to the Credit Agreement.
Energy Recovery, Inc. | 2021 Form 10-K Annual Report | 38
Share Repurchase Program
On March 9, 2021, our Board of Directors authorized a share repurchase program (the “March 2021 Authorization”) which we may repurchase, under management’s discretion, up to $50.0 million in aggregate cost of our outstanding common stock. As of December 31, 2021, under the March 2021 Authorization, we may repurchase additional shares of our outstanding common stock at an aggregate cost of approximately $26.7 million. During the year ended December 31, 2021, we repurchased 1,265,218 shares at an aggregate cost of approximately $23.3 million.
Cash Flows
| | | | | | | | | | | | | | | | | | | | | |
| | Years Ended December 31, | | | | | | |
| | 2021 | | 2020 | | Change | | | | |
| | (In thousands) | | |
| Net cash provided by operating activities | $ | 13,526 | | | $ | 16,870 | | | $ | (3,344) | | | | | |
| Net cash (used in) provided by investing activities | (20,563) | | | 46,600 | | | (67,163) | | | | | |
| Net cash (used in) provided by financing activities | (12,792) | | | 4,374 | | | (17,166) | | | | | |
| Effect of exchange rate differences on cash and cash equivalents | (68) | | | 26 | | | (94) | | | | | |
| Net change in cash, cash equivalents and restricted cash | $ | (19,897) | | | $ | 67,870 | | | $ | (87,767) | | | | | |
| | | | | | | | | |
| | | | | | | | | |
| | | | | | | | | |
| | | | | | | | | |
| | | | | | | | | |
Cash Flows from Operating Activities
Net cash provided by operating activities is subject to the project driven, non-cyclical nature of our business. Operating cash flow can fluctuate significantly from year to year, due to the timing of receipts of large project orders. Operating cash flow may be negative in one year and significantly positive in the next, consequently individual quarterly results and comparisons may not necessarily indicate a significant trend, either positive or negative.
Net cash provided by operating activities for the year ended December 31, 2021, compared to net cash provided by operating activities for the year ended December 31, 2020, was lower due primarily to increased planned inventory purchases and finished goods production, and timing of invoices and cash collected on accounts receivables related to higher fourth quarter of fiscal year 2021 product revenues. Regarding cash used for inventory, raw material inventory was increased according to our production forecast and to ensure there is sufficient raw material supply to mitigate any supply chain issues, such as potential shipment delays related to port congestion, and/or supplier material and labor shortages. Finished goods inventory was increased according to our shipment forecast as well as increasing inventory for future demand while maintaining reasonable minimums to be able react to certain market conditions.
Cash Flows from Investing Activities
Net cash (used in) provided by investing activities primarily relates to maturities, sales and purchases of marketable securities, and capital expenditures supporting our growth. Our investments in marketable securities are structured to preserve principal and liquidity while at the same time maximizing yields without significantly increasing risk. The cash used in investing activities for the year ended December 31, 2021, as compared to cash provided by investing activities in the year ended December 31, 2020, was due primarily to the purchase of debt securities. In fiscal 2020, we shifted our investment strategy from investment in debt securities to holding cash in money market funds due to the uncertainty caused by the COVID-19 pandemic; however, in the third quarter of 2021, we started to shift our investment strategy from holding cash in money market funds back to investment in debt securities.
Cash Flows from Financing Activities
Net cash (used in) provided by financing activities primarily relates to the issuance of equity from our employee equity incentive plans and offset by share repurchases under our board authorized share repurchase program. Net cash used in financing activities for the year ended December 31, 2021, was $17.2 million lower than the net cash provided by financing activities for the year ended December 31, 2020, due primarily to share repurchases of $23.3 million under the March 2021 Authorization, partially offset by higher issuance of equity of $6.2 million related to our employee equity incentive plans.
Energy Recovery, Inc. | 2021 Form 10-K Annual Report | 39
Liquidity and Capital Resource Requirements
We believe that our existing resources and cash generated from our operations will be sufficient to meet our anticipated capital requirements for at least the next 12 months. However, we may need to raise additional capital or incur additional indebtedness to continue to fund our operations or to support acquisitions in the future and/or to fund investments in our latest technology arising from rapid market adoption. These needs could require us to seek additional equity or debt financing. Our future capital requirements will depend on many factors including the continuing market acceptance of our products, our rate of revenue growth, the timing of new product introductions, the expansion of our R&D, manufacturing and S&M activities, the timing and extent of our expansion into new geographic territories and the amount and timing of cash used for stock repurchases. In addition, we may enter into potential material investments in, or acquisitions of, complementary businesses, services or technologies in the future which could also require us to seek additional equity or debt financing. Should we need additional liquidity or capital funds, these funds may not be available to us on favorable terms, or at all.
Facility and Equipment Leases. We lease facilities and equipment under fixed noncancelable operating leases that expire on various dates through fiscal year 2030. See Note 7, “Commitments and Contingencies – Operating Lease Obligations,” of the Notes for additional information related to our fixed noncancelable operating leases.
Purchase Order Arrangements. We have purchase order arrangements with our vendors for which we have not received the related goods or services. These arrangements are subject to change based on our sales demand forecasts. We have the right to cancel the arrangements prior to the date of delivery. The purchase order arrangements are related to various raw materials and component parts, as well as capital equipment. See Note 7, “Commitments and Contingencies – Purchase Obligations,” of the Notes for additional information related to our purchase order arrangements.
Off-balance Sheet Arrangements. During the periods presented, we did not have any relationships with unconsolidated entities or financial partnerships such as entities often referred to as structured finance or special purpose entities which would have been established for the purpose of facilitating off-balance sheet arrangements or other contractually narrow or limited purposes.
Critical Accounting Policies and Estimates
Our Consolidated Financial Statements are prepared in accordance with U.S. GAAP. These accounting principles require us to make estimates and judgments that can affect the reported amounts of assets and liabilities as of the date of the Consolidated Financial Statements as well as the reported amounts of revenue and expense during the periods presented. We believe that the estimates and judgments upon which we rely are reasonable based upon information available to us at the time that we make these estimates and judgments. To the extent that there are material differences between these estimates and actual results, our consolidated financial results will be affected. The accounting policies that reflect our more significant estimates and judgments and which we believe are the most critical to aid in fully understanding and evaluating our reported financial results are revenue recognition; valuation of stock options; valuation and impairment of goodwill; inventory; and deferred taxes and valuation allowances on deferred tax assets.
The following is not intended to be a comprehensive list of all of our accounting policies or estimates. See Note 1, “Description of Business and Significant Accounting Policies,” of the Notes for further detailed discussion regarding our accounting policies and estimates.
Revenue Recognition
Revenues are recognized when control of the promised goods or services is transferred to our customers in an amount that reflects the consideration we expect to be entitled to in exchange for those goods or services. At the inception of each contract, performance obligations are identified and the total transaction price is allocated to the performance obligations. Our contracts with customers may include multiple performance obligations. For such arrangements, we allocate revenue to each performance obligation based on its relative stand-alone selling price. We generally determine standalone selling prices based on the prices charged to customers. With respect to termination, we do not have the ability to cancel a contract for convenience. In general, customers can cancel for convenience upon the payment of a termination fee that covers costs and profit. It is rare for customers to cancel contracts. See Note 1, “Description of Business and Significant Accounting Policies – Significant Accounting Policies, §Revenue Recognition (Product and Service Revenue Recognition - Water Segment),” of the Notes for more detail on Water segment product and service revenue recognition.
Energy Recovery, Inc. | 2021 Form 10-K Annual Report | 40
Stock-based Compensation
We account for share-based compensation according to U.S. GAAP relating to share-based payments, which requires the measurement and recognition of compensation expense for all share-based awards made to employees and directors based on estimated fair values on the grant date. This guidance requires that we estimate the fair value of share-based awards on the date of grant and recognize as expense the value of the portion of the award that is ultimately expected to vest over the requisite service period. See Note 1, “Description of Business and Significant Accounting Policies – Significant Accounting Policies, §Stock-based Compensation” and Note 10, “Stock-based Compensation,” of the Notes for further discussion of our accounting policy and stock-based compensation activities, respectively.
Goodwill
Our goodwill represents the excess of the purchase price of a business combination over the fair value of the net assets acquired. Goodwill impairment testing requires significant judgment and management estimates, including, but not limited to, the determination of (i) the number of reporting units, (ii) the goodwill and other assets and liabilities to be allocated to the reporting units and (iii) the fair values of the reporting units. The estimates and assumptions described above, along with other factors such as discount rates, will significantly affect the outcome of the impairment tests and the amounts of any resulting impairment losses. We perform a quantitative assessment of goodwill for impairment on an annual basis during the third quarter of each year, and between annual tests, a qualitative assessment whenever events or changes in circumstances indicate that the carrying amount may not be recoverable. If these interim qualitative factors were to indicate that it is more-likely-than-not that the fair value of the reporting unit is less than its carrying value, we would then perform a quantitative assessment, which would consist primarily of a discounted cash flow (“DCF”) analysis to determine the fair value of the reporting unit’s goodwill. To the extent the carrying amount of the reporting unit’s allocated goodwill exceeds the unit’s fair value, we recognize an impairment of goodwill for the excess up to the amount of goodwill of that reporting unit. See Note 1, “Description of Business and Significant Accounting Policies – Significant Accounting Policies, §Goodwill” and Note 4, “Other Financial Information – Goodwill and Other Intangible Assets, §Goodwill,” of the Notes for further discussion of our accounting policy and goodwill activities, respectively.
Inventories
We determine at each balance sheet date how much, if any, of our inventory may ultimately prove to be either unsalable or unsalable at its carrying cost. Reserves are established to effectively adjust the carrying value of such inventory to lower of cost (first-in, first-out method) or net realizable value. To determine the appropriate level of valuation reserves, we evaluate current stock levels in relation to historical and expected patterns of demand for all of our products. We evaluate the need for changes to valuation reserves based on market conditions, competitive offerings, and other factors on a regular basis. See Note 1, “Description of Business and Significant Accounting Policies – Significant Accounting Policies, §Inventories” and Note 4, “Other Financial Information – Inventories, net,” of the Notes for further discussion of our accounting policy and estimates, and inventory activities, respectively.
Income Taxes
Our annual tax rate is determined based on our income and the jurisdictions where it is earned, statutory tax rates, and the tax impacts of items treated differently for tax purposes than for financial reporting purposes. Also inherent in determining our annual tax rate are judgments and assumptions regarding the recoverability of certain deferred tax balances, and our ability to uphold certain tax positions. We are subject to complex tax laws, in the U.S. and numerous foreign jurisdictions, and the manner in which they apply can be open to interpretation. Realization of deferred tax assets is dependent upon generating sufficient taxable income in the appropriate jurisdiction in future periods, which involves business plans, planning opportunities, and expectations about future outcomes. Our assessment relies on estimates and assumptions, and may involve a series of complex judgments about future events. We use an estimate of our annual effective tax rate at each interim period based on the facts and circumstances available at that time, while the actual effective tax rate is calculated at year-end. See Note 1, “Description of Business and Significant Accounting Policies – Significant Accounting Policies, §Income Taxes” and Note 8, “Income Taxes,” of the Notes for further discussion of our income tax policy and our tax valuation allowance, respectively.
Recent Accounting Pronouncements
Refer to Note 1, “Description of Business and Significant Accounting Policies – Recent Accounting Pronouncements,” of the Notes.
Energy Recovery, Inc. | 2021 Form 10-K Annual Report | 41
Item 7A — Quantitative and Qualitative Disclosures About Market Risk
Our exposure to market risk may be found primarily in two areas, foreign currency and interest rates.
Foreign Currency Risk
Our foreign currency exposures are due to fluctuations in exchange rates for U.S. dollar (“USD”) versus the British pound, Saudi riyal, Emirati dirham, European euro, Chinese yuan, Indian rupee and Canadian dollar. Changes in currency exchange rates could adversely affect our consolidated operating results or financial position.
Our revenue contracts have been denominated in USD. At times, our international customers may have difficulty in obtaining USD to pay our receivables, thus increasing collection risk and potential doubtful account expense. As we expand our international sales, a portion of our revenue could be denominated in foreign currencies. As a result, our cash and operating results could be increasingly affected by changes in exchange rates.
In addition, we pay many vendors in foreign currency and, therefore, are subject to changes in foreign currency exchange rates. Our international sales and service operations incur expense that is denominated in foreign currencies. This expense could be materially affected by currency fluctuations. Our international sales and services operations also maintain cash balances denominated in foreign currencies. To decrease the inherent risk associated with translation of foreign cash balances into our reporting currency, we do not maintain excess cash balances in foreign currencies.
We have not hedged our exposure to changes in foreign currency exchange rates because expenses in foreign currencies have been insignificant to date and exchange rate fluctuations have had little impact on our operating results and cash flows.
Interest Rate and Credit Risks
The primary objective of our investment activities is to preserve principal and liquidity while at the same time maximizing yields without significantly increasing risk. We invest primarily in investment-grade short-term and long-term high-quality marketable debt instruments that are subject to counter-party credit risk. To minimize this risk, we invest pursuant to an investment policy approved by our board of directors. The policy mandates high credit rating requirements and restricts our exposure to any single corporate issuer by imposing concentration limits.
As of December 31, 2021, our investment portfolio of $33.6 million, in investment-grade short-term and long-term high-quality marketable debt instruments, such as U.S. treasury securities, and corporate notes and bonds, are classified as either short-term and/or long-term investments on our Consolidated Balance Sheets. These investments are subject to interest rate fluctuations and will decrease in market value if interest rates increase. To minimize the exposure due to adverse shifts in interest rates, we maintain investments with a weighted average maturity of less than six months. As of December 31, 2021, a hypothetical 1% increase in interest rates would have resulted in a less than $0.1 million decrease in the fair value of our fixed-income debt securities.
Energy Recovery, Inc. | 2021 Form 10-K Annual Report | 42
Item 8 — Financial Statements and Supplementary Data
| | | | | |
| Page No. |
| |
| |
| Consolidated Financial Statements: | |
| |
| |
| |
| |
| |
| |
| |
| |
| |
Energy Recovery, Inc. | 2021 Form 10-K Annual Report | 43
REPORT OF INDEPENDENT REGISTERED PUBLIC ACCOUNTING FIRM
To the stockholders and the Board of Directors of Energy Recovery, Inc.
Opinion on the Financial Statements
We have audited the accompanying consolidated balance sheets of Energy Recovery, Inc. and subsidiaries (the “Company”) as of December 31, 2021 and 2020, the related consolidated statements of operations, comprehensive income, stockholders’ equity, and cash flows, for each of the three years in the period ended December 31, 2021, and the related notes (collectively referred to as the “financial statements”). In our opinion, the financial statements present fairly, in all material respects, the financial position of the Company as of December 31, 2021 and 2020, and the results of its operations and its cash flows for each of the three years in the period ended December 31, 2021, in conformity with accounting principles generally accepted in the United States of America.
We have also audited, in accordance with the standards of the Public Company Accounting Oversight Board (United States) (PCAOB), the Company's internal control over financial reporting as of December 31, 2021, based on criteria established in Internal Control — Integrated Framework (2013) issued by the Committee of Sponsoring Organizations of the Treadway Commission and our report dated February 24, 2022, expressed an unqualified opinion on the Company's internal control over financial reporting.
Basis for Opinion
These financial statements are the responsibility of the Company's management. Our responsibility is to express an opinion on the Company's financial statements based on our audits. We are a public accounting firm registered with the PCAOB and are required to be independent with respect to the Company in accordance with the U.S. federal securities laws and the applicable rules and regulations of the Securities and Exchange Commission and the PCAOB.
We conducted our audits in accordance with the standards of the PCAOB. Those standards require that we plan and perform the audit to obtain reasonable assurance about whether the financial statements are free of material misstatement, whether due to error or fraud. Our audits included performing procedures to assess the risks of material misstatement of the financial statements, whether due to error or fraud, and performing procedures that respond to those risks. Such procedures included examining, on a test basis, evidence regarding the amounts and disclosures in the financial statements. Our audits also included evaluating the accounting principles used and significant estimates made by management, as well as evaluating the overall presentation of the financial statements. We believe that our audits provide a reasonable basis for our opinion.
Critical Audit Matter
The critical audit matter communicated below is a matter arising from the current-period audit of the financial statements that was communicated or required to be communicated to the audit committee and that (1) relates to accounts or disclosures that are material to the financial statements and (2) involved our especially challenging, subjective, or complex judgments. The communication of critical audit matters does not alter in any way our opinion on the financial statements, taken as a whole, and we are not, by communicating the critical audit matter below, providing a separate opinion on the critical audit matter or on the accounts or disclosures to which it relates.
Revenue Recognition – Refer to Notes 1 and 2 to the financial statements
Critical Audit Matter Description
Revenue in the Company’s Water segment is recognized upon transfer of control of products which typically follows transfer of title upon shipment or delivery in accordance with International Commercial Terms (“incoterms”). The processing and recording of the Company’s revenue transactions is a combination of automated and manual processes (i.e. the revenue transactions are recorded automatically upon invoice generation at the time of shipment, whereas the review process remains relatively manual to ensure control has properly transferred to recognize revenue) and therefore the Company uses a precise set of procedures to ensure revenue is accurate for each transaction. For the year ended December 31, 2021, the Company recorded $103.9 million in product revenue.
Energy Recovery, Inc. | 2021 Form 10-K Annual Report | 44
We identified the Company’s revenue recognition processes as a critical audit matter as the Company has a significant volume of revenue transactions throughout the year and a manual process to generate accurate data to process and record revenue in line with when risk is transferred to the customers. This required an increased extent of effort to audit these revenue transactions.
How the Critical Audit Matter Was Addressed in the Audit
Our audit procedures related to revenue recognition included the following, among others:
•We tested the design and effectiveness of controls over the recognition of revenue.
•We obtained an understanding of the nature of the revenue recognition process through inquiry with the Company personnel responsible for the invoices as well as review of the contracts with the customers.
•For a sample of processed revenue transactions, we traced and agreed the calculation of the Company’s recorded revenue and the timing of revenue recognition to source documents such as the agreed upon terms with the customer and shipping records, as well as the related invoices generated within the system and evaluated any differences.
/s/ Deloitte & Touche LLP
San Francisco, California
February 24, 2022
We have served as the Company’s auditor since 2018.
Energy Recovery, Inc. | 2021 Form 10-K Annual Report | 45
REPORT OF INDEPENDENT REGISTERED PUBLIC ACCOUNTING FIRM
To the stockholders and the Board of Directors of Energy Recovery, Inc.
Opinion on Internal Control over Financial Reporting
We have audited the internal control over financial reporting of Energy Recovery, Inc. and subsidiaries (the “Company”) as of December 31, 2021, based on criteria established in Internal Control — Integrated Framework (2013) issued by the Committee of Sponsoring Organizations of the Treadway Commission (COSO). In our opinion, the Company maintained, in all material respects, effective internal control over financial reporting as of December 31, 2021, based on criteria established in Internal Control — Integrated Framework (2013) issued by COSO.
We have also audited, in accordance with the standards of the Public Company Accounting Oversight Board (United States) (PCAOB), the consolidated financial statements as of and for the year ended December 31, 2021, of the Company and our report dated February 24, 2022, expressed an unqualified opinion on those financial statements.
Basis for Opinion
The Company’s management is responsible for maintaining effective internal control over financial reporting and for its assessment of the effectiveness of internal control over financial reporting, included in the accompanying “Management’s Report on Internal Control Over Financial Reporting.” Our responsibility is to express an opinion on the Company’s internal control over financial reporting based on our audit. We are a public accounting firm registered with the PCAOB and are required to be independent with respect to the Company in accordance with the U.S. federal securities laws and the applicable rules and regulations of the Securities and Exchange Commission and the PCAOB.
We conducted our audit in accordance with the standards of the PCAOB. Those standards require that we plan and perform the audit to obtain reasonable assurance about whether effective internal control over financial reporting was maintained in all material respects. Our audit included obtaining an understanding of internal control over financial reporting, assessing the risk that a material weakness exists, testing and evaluating the design and operating effectiveness of internal control based on the assessed risk, and performing such other procedures as we considered necessary in the circumstances. We believe that our audit provides a reasonable basis for our opinion.
Definition and Limitations of Internal Control over Financial Reporting
A company’s internal control over financial reporting is a process designed to provide reasonable assurance regarding the reliability of financial reporting and the preparation of financial statements for external purposes in accordance with generally accepted accounting principles. A company’s internal control over financial reporting includes those policies and procedures that (1) pertain to the maintenance of records that, in reasonable detail, accurately and fairly reflect the transactions and dispositions of the assets of the company; (2) provide reasonable assurance that transactions are recorded as necessary to permit preparation of financial statements in accordance with generally accepted accounting principles, and that receipts and expenditures of the company are being made only in accordance with authorizations of management and directors of the company; and (3) provide reasonable assurance regarding prevention or timely detection of unauthorized acquisition, use, or disposition of the company’s assets that could have a material effect on the financial statements.
Because of its inherent limitations, internal control over financial reporting may not prevent or detect misstatements. Also, projections of any evaluation of effectiveness to future periods are subject to the risk that controls may become inadequate because of changes in conditions, or that the degree of compliance with the policies or procedures may deteriorate.
/s/ Deloitte & Touche LLP
San Francisco, California
February 24, 2022
Energy Recovery, Inc. | 2021 Form 10-K Annual Report | 46
ENERGY RECOVERY, INC.
CONSOLIDATED BALANCE SHEETS
| | | | | | | | | | | |
| December 31, |
| 2021 | | 2020 |
| (In thousands, except shares and per share data) |
| ASSETS | | | |
| Current assets: | | | |
| Cash and cash equivalents | $ | 74,358 | | | $ | 94,255 | |
| Short-term investments | 31,332 | | | 20,446 | |
| Accounts receivable, net | 20,615 | | | 11,792 | |
| Inventories, net | 20,383 | | | 11,748 | |
| | | |
| | | |
| | | |
| Prepaid expenses and other assets | 5,075 | | | 4,950 | |
| Total current assets | 151,763 | | | 143,191 | |
| Long-term investments | 2,298 | | | — | |
| Deferred tax assets, net | 11,421 | | | 11,030 | |
| Property and equipment, net | 20,361 | | | 20,176 | |
| Operating lease, right of use asset | 14,653 | | | 16,090 | |
| Goodwill and other intangible assets | 12,827 | | | 12,839 | |
| Other assets, non-current | 367 | | | 988 | |
| Total assets | $ | 213,690 | | | $ | 204,314 | |
| LIABILITIES AND STOCKHOLDERS’ EQUITY | | | |
| Current liabilities: | | | |
| Accounts payable | $ | 909 | | | $ | 1,118 | |
| Accrued expenses and other liabilities | 13,994 | | | 11,816 | |
| Lease liabilities | 1,564 | | | 1,243 | |
| Contract liabilities | 3,318 | | | 1,552 | |
| Total current liabilities | 19,785 | | | 15,729 | |
| Lease liabilities, non-current | 14,879 | | | 16,443 | |
| | | |
| | | |
| | | |
| Other liabilities, non-current | 247 | | | 518 | |
| Total liabilities | 34,911 | | | 32,690 | |
| Commitments and contingencies (Note 7) | | | |
| Stockholders’ equity: | | | |
Preferred stock, $0.001 par value; 10,000,000 shares authorized; no shares issued or outstanding at December 31, 2021 and 2020 | — | | | — | |
| | | |
Common stock, $0.001 par value; 200,000,000 shares authorized; 63,544,419 shares issued and 56,823,266 shares outstanding at December 31, 2021 and 61,798,004 shares issued and 56,342,069 shares outstanding at December 31, 2020 | 64 | | | 62 | |
| Additional paid-in capital | 195,593 | | | 179,161 | |
| Accumulated other comprehensive (loss) income | (149) | | | 53 | |
| | | |
Treasury stock, at cost, 6,721,153 shares repurchased at December 31, 2021 and 5,455,935 shares repurchased at December 31, 2020 | (53,832) | | | (30,486) | |
| Retained earnings | 37,103 | | | 22,834 | |
| Total stockholders’ equity | 178,779 | | | 171,624 | |
| Total liabilities and stockholders’ equity | $ | 213,690 | | | $ | 204,314 | |
| | | |
| | | |
| | | |
See Accompanying Notes to Consolidated Financial Statements
Energy Recovery, Inc. | 2021 Form 10-K Annual Report | 47
ENERGY RECOVERY, INC.
CONSOLIDATED STATEMENTS OF OPERATIONS
| | | | | | | | | | | | | | | | | | | | | |
| | | | Years Ended December 31, |
| | | | | | 2021 | | 2020 | | 2019 |
| | | | | | (In thousands, except per share data) |
| Product revenue | | | | | $ | 103,904 | | | $ | 92,091 | | | $ | 72,834 | |
| Product cost of revenue | | | | | 32,670 | | | 28,249 | | | 20,335 | |
| Product gross profit | | | | | 71,234 | | | 63,842 | | | 52,499 | |
| | | | | | | | | |
| License and development revenue | | | | | — | | | 26,895 | | | 14,108 | |
| | | | | | | | | |
| Operating expenses: | | | | | | | | | |
| General and administrative | | | | | 25,162 | | | 25,519 | | | 22,832 | |
| Sales and marketing | | | | | 12,160 | | | 8,127 | | | 9,434 | |
| Research and development | | | | | 20,069 | | | 23,449 | | | 23,402 | |
| Amortization of intangible assets | | | | | 12 | | | 16 | | | 575 | |
| | | | | | | | | |
| Impairment of long-lived assets | | | | | — | | | 2,332 | | | — | |
| | | | | | | | | |
| | | | | | | | | |
| Total operating expenses | | | | | 57,403 | | | 59,443 | | | 56,243 | |
| Income from operations | | | | | 13,831 | | | 31,294 | | | 10,364 | |
| | | | | | | | | |
| Other income (expense): | | | | | | | | | |
| Interest income | | | | | 204 | | | 913 | | | 2,010 | |
| | | | | | | | | |
| Other non-operating expense, net | | | | | (31) | | | (74) | | | (118) | |
| Total other income, net | | | | | 173 | | | 839 | | | 1,892 | |
| Income before income taxes | | | | | 14,004 | | | 32,133 | | | 12,256 | |
| (Benefit from) provision for income taxes | | | | | (265) | | | 5,746 | | | 1,343 | |
| Net income | | | | | $ | 14,269 | | | $ | 26,387 | | | $ | 10,913 | |
| | | | | | | | | |
| Net income per share: | | | | | | | | | |
| Basic | | | | | $ | 0.25 | | | $ | 0.47 | | | $ | 0.20 | |
| Diluted | | | | | $ | 0.24 | | | $ | 0.47 | | | $ | 0.19 | |
| | | | | | | | | |
| Number of shares used in per share calculations: | | | | | | | | | |
| Basic | | | | | 56,993 | | | 55,709 | | | 54,740 | |
| Diluted | | | | | 58,723 | | | 56,637 | | | 56,067 | |
| | | | | | | | | |
See Accompanying Notes to Consolidated Financial Statements
Energy Recovery, Inc. | 2021 Form 10-K Annual Report | 48
ENERGY RECOVERY, INC.
CONSOLIDATED STATEMENTS OF COMPREHENSIVE INCOME
| | | | | | | | | | | | | | | | | | | | | |
| | | | Year Ended December 31, |
| | | | | | 2021 | | 2020 | | 2019 |
| | | | | | (In thousands) |
| Net income | | | | | $ | 14,269 | | | $ | 26,387 | | | $ | 10,913 | |
| Other comprehensive (loss) income, net of tax | | | | | | | | | |
| Foreign currency translation adjustments | | | | | (68) | | | 26 | | | (23) | |
| Unrealized (loss) gain on investments | | | | | (134) | | | 64 | | | 119 | |
| Total other comprehensive (loss) income, net of tax | | | | | (202) | | | 90 | | | 96 | |
| Comprehensive income | | | | | $ | 14,067 | | | $ | 26,477 | | | $ | 11,009 | |
| | | | | | | | | |
See Accompanying Notes to Consolidated Financial Statements
Energy Recovery, Inc. | 2021 Form 10-K Annual Report | 49
ENERGY RECOVERY, INC.
CONSOLIDATED STATEMENTS OF STOCKHOLDERS’ EQUITY
| | | | | | | | | | | | | | | | | | | | | |
| | | | Years Ended December 31, |
| | | | | | 2021 | | 2020 | | 2019 |
| | | | | | (In thousands, except shares) |
| Common stock | | | | | | | | | |
| Beginning balance | | | | | $ | 62 | | | $ | 61 | | | $ | 59 | |
| Issuance of common stock, net | | | | | 2 | | | 1 | | | 2 | |
| Ending balance | | | | | 64 | | | 62 | | | 61 | |
| | | | | | | | | |
| Additional paid-in capital | | | | | | | | | |
| Beginning balance | | | | | 179,161 | | | 170,028 | | | 158,404 | |
| Issuance of common stock, net | | | | | 10,552 | | | 4,373 | | | 5,960 | |
| Stock-based compensation | | | | | 5,880 | | | 4,760 | | | 5,664 | |
| Ending balance | | | | | 195,593 | | | 179,161 | | | 170,028 | |
| | | | | | | | | |
| Accumulated other comprehensive (loss) income | | | | | | | | | |
| Beginning balance | | | | | 53 | | | (37) | | | (133) | |
| Other comprehensive (loss) income | | | | | | | | | |
| Foreign currency translation adjustments | | | | | (68) | | | 26 | | | (23) | |
| Unrealized (loss) gain on investments | | | | | (134) | | | 64 | | | 119 | |
| Total other comprehensive (loss) income, net | | | | | (202) | | | 90 | | | 96 | |
| Ending balance | | | | | (149) | | | 53 | | | (37) | |
| | | | | | | | | |
| Treasury stock | | | | | | | | | |
| Beginning balance | | | | | (30,486) | | | (30,486) | | | (30,486) | |
| Common stock repurchased | | | | | (23,346) | | | — | | | — | |
| | | | | | | | | |
| Ending balance | | | | | (53,832) | | | (30,486) | | | (30,486) | |
| | | | | | | | | |
| Retained earnings (accumulated deficit) | | | | | | | | | |
| Beginning balance | | | | | 22,834 | | | (3,553) | | | (14,466) | |
| Net income | | | | | 14,269 | | | 26,387 | | | 10,913 | |
| Ending balance | | | | | 37,103 | | | 22,834 | | | (3,553) | |
| | | | | | | | | |
| Total stockholders’ equity | | | | | $ | 178,779 | | | $ | 171,624 | | | $ | 136,013 | |
| | | | | | | | | |
| Common stock issued (shares) | | | | | | | | | |
| Beginning balance | | | | | 61,798,004 | | | 60,717,702 | | | 59,396,020 | |
| Issuance of common stock, net | | | | | 1,746,415 | | | 1,080,302 | | | 1,321,682 | |
| Ending balance | | | | | 63,544,419 | | | 61,798,004 | | | 60,717,702 | |
| | | | | | | | | |
| Treasury stock (shares) | | | | | | | | | |
| Beginning balance | | | | | 5,455,935 | | | 5,455,935 | | | 5,455,935 | |
| Common stock repurchased | | | | | 1,265,218 | | | — | | | — | |
| | | | | | | | | |
| Ending balance | | | | | 6,721,153 | | | 5,455,935 | | | 5,455,935 | |
| | | | | | | | | |
| Total common stock outstanding (shares) | | | | | 56,823,266 | | | 56,342,069 | | | 55,261,767 | |
| | | | | | | | | |
| | | | | | | | | |
See Accompanying Notes to Consolidated Financial Statements
Energy Recovery, Inc. | 2021 Form 10-K Annual Report | 50
ENERGY RECOVERY, INC.
CONSOLIDATED STATEMENTS OF CASH FLOWS
| | | | | | | | | | | | | | | | | | | | | |
| | | Years Ended December 31, |
| | | | | 2021 | | 2020 | | 2019 |
| | | | | (In thousands) |
| Cash flows from operating activities: | | | | | | | | | |
| Net income | | | | | $ | 14,269 | | | $ | 26,387 | | | $ | 10,913 | |
| Adjustments to reconcile net income to cash provided by operating activities | | | | | | | | | |
| Stock-based compensation | | | | | 6,053 | | | 4,787 | | | 5,676 | |
| Depreciation and amortization | | | | | 5,939 | | | 5,299 | | | 4,395 | |
| Amortization of premiums and discounts on investments | | | | | 570 | | | 390 | | | 65 | |
| Deferred income taxes | | | | | (391) | | | 5,867 | | | 1,421 | |
| Impairment of long-lived assets | | | | | — | | | 2,332 | | | — | |
| | | | | | | | | |
| | | | | | | | | |
| | | | | | | | | |
| | | | | | | | | |
| | | | | | | | | |
| | | | | | | | | |
| | | | | | | | | |
| | | | | | | | | |
| | | | | | | | | |
| | | | | | | | | |
| | | | | | | | | |
| Other non-cash adjustments | | | | | 955 | | | 395 | | | 494 | |
| Changes in operating assets and liabilities: | | | | | | | | | |
| Accounts receivable, net | | | | | (8,823) | | | 1,098 | | | (2,679) | |
| | | | | | | | | |
| Contract assets | | | | | 1,399 | | | (1,200) | | | 3,391 | |
| Inventories, net | | | | | (8,766) | | | (1,622) | | | (3,256) | |
| Prepaid and other assets | | | | | 314 | | | 415 | | | (263) | |
| Accounts payable | | | | | (155) | | | (205) | | | (373) | |
| | | | | | | | | |
| Accrued expenses and other liabilities | | | | | 396 | | | 153 | | | (573) | |
| | | | | | | | | |
| Contract liabilities | | | | | 1,766 | | | (27,226) | | | (13,943) | |
| Net cash provided by operating activities | | | | | 13,526 | | | 16,870 | | | 5,268 | |
| Cash flows from investing activities: | | | | | | | | | |
| Sales of marketable securities | | | | | — | | | 10,573 | | | 7,608 | |
| Maturities of marketable securities | | | | | 35,019 | | | 55,667 | | | 78,100 | |
| Purchases of marketable securities | | | | | (48,903) | | | (12,855) | | | (85,207) | |
| Capital expenditures | | | | | (6,679) | | | (6,785) | | | (7,382) | |
| | | | | | | | | |
| Net cash (used in) provided by investing activities | | | | | (20,563) | | | 46,600 | | | (6,881) | |
| Cash flows from financing activities: | | | | | | | | | |
| Net proceeds from issuance of common stock | | | | | 10,554 | | | 4,397 | | | 6,073 | |
| Tax payment for employee shares withheld | | | | | — | | | (23) | | | (110) | |
| | | | | | | | | |
| | | | | | | | | |
| | | | | | | | | |
| Repurchase of common stock | | | | | (23,346) | | | — | | | — | |
| Net cash (used in) provided by financing activities | | | | | (12,792) | | | 4,374 | | | 5,963 | |
| Effect of exchange rate differences on cash and cash equivalents | | | | | (68) | | | 26 | | | — | |
| Net change in cash, cash equivalents and restricted cash | | | | | (19,897) | | | 67,870 | | | 4,350 | |
| Cash, cash equivalents and restricted cash, beginning of year | | | | | 94,358 | | | 26,488 | | | 22,138 | |
| Cash, cash equivalents and restricted cash, end of year | | | | | $ | 74,461 | | | $ | 94,358 | | | $ | 26,488 | |
| Supplemental disclosure of cash flow information: | | | | | | | | | |
| | | | | | | | | |
| Cash received for income tax refunds | | | | | $ | 270 | | | $ | 13 | | | 438 | |
| Cash paid for income taxes | | | | | 76 | | | 52 | | | 52 | |
| Supplemental disclosure on non-cash investing and financing transactions: | | | | | | | | | |
| Purchases of property and equipment in trade accounts payable, and accrued expenses and other liabilities | | | | | $ | 421 | | | $ | 322 | | | $ | 1,080 | |
| Non-cash lease liabilities arising from obtaining right of use assets | | | | | — | | | 6,384 | | | — | |
| | | | | | | | | |
See Accompanying Notes to Consolidated Financial Statements
Energy Recovery, Inc. | 2021 Form 10-K Annual Report | 51
ENERGY RECOVERY, INC.
NOTES TO CONSOLIDATED FINANCIAL STATEMENTS
Note 1 — Description of Business and Significant Accounting Policies
Energy Recovery, Inc. and its wholly-owned subsidiaries (the “Company” or “Energy Recovery”) designs and manufactures solutions that make industrial processes more efficient and sustainable. Leveraging the Company’s pressure exchanger technology, which generates little to no emissions when operating, the Company’s solutions lower costs, save energy, reduce waste and minimize emissions for companies across a variety of industrial processes. As the world coalesces around the urgent need to address climate change and its impacts, the Company is at the forefront on helping companies reduce their energy consumption in their industrial processes, which in turn, reduces their carbon footprint. The Company believes that its customers do not have to sacrifice quality and cost savings for sustainability and is committed to developing solutions that drive long-term value – both financial and environmental. The Company’s solutions are marketed, sold in, or developed for, the fluid-flow and gas markets, such as seawater and industrial wastewater desalination, natural gas, chemical processing and refrigeration, under the trademarks ERI®, Ultra PX™, PX®, Pressure Exchanger®, PX Pressure Exchanger® (“PX”), PX PowerTrain™, VorTeq™, IsoBoost®, AT™, and AquaBold™. The Company owns, manufactures and/or develops its solutions, in whole or in part, in the United States of America (the “U.S.”).
Basis of Presentation
The Consolidated Financial Statements include the accounts of Energy Recovery, Inc. and its wholly-owned subsidiaries. All intercompany accounts and transactions have been eliminated in consolidation.
Reclassifications
Certain prior period amounts have been reclassified in the Consolidated Balance Sheets, Consolidated Statements of Cash Flows, and certain notes to the Consolidated Financial Statements, to conform to the current period presentation.
Use of Estimates
The preparation of Consolidated Financial Statements, in conformity with U.S. generally accepted accounting principles (“GAAP”), requires the Company’s management to make judgments, assumptions and estimates that affect the amounts reported in the Consolidated Financial Statements and accompanying notes.
The accounting policies that reflect the Company’s more significant estimates and judgments and that the Company believes are the most critical to aid in fully understanding and evaluating its reported financial results are revenue recognition; valuation of stock options; valuation and impairment of goodwill; inventory; deferred taxes and valuation allowances on deferred tax assets; and evaluation and measurement of contingencies. Those estimates could change, and as a result, actual results could differ materially from those estimates.
Due to the novel coronavirus (“COVID-19”) pandemic, and the impact on the Company’s customers, there has been uncertainty and disruption in the global economy and financial markets. The Company is not aware of any specific event or circumstance that would require an update to its estimates or judgments or a revision of the carrying value of its assets or liabilities as of February 24, 2022, the date of issuance of this Annual Report on Form 10-K. These estimates may change, as new events occur and additional information is obtained. Actual results could differ materially from these estimates under different assumptions or conditions. The Company undertakes no obligation to update publicly these estimates for any reason after the date of this Annual Report on Form 10-K, except as required by law.
Energy Recovery, Inc. | 2021 Form 10-K Annual Report | 52
ENERGY RECOVERY, INC.
NOTES TO CONSOLIDATED FINANCIAL STATEMENTS
Significant Accounting Policies
Cash and Cash Equivalents
The Company considers all highly liquid investments with an original or remaining contractual maturity on date of purchase of less than or equal to three months to be classified and presented as cash equivalents on the Consolidated Balance Sheets. Cash equivalents are stated at cost, which approximates fair value. The Company’s cash and cash equivalents may include demand deposit accounts with large financial institutions, institutional money market funds, U.S. treasury securities, and corporate notes and bonds. The Company monitors the creditworthiness of the financial institutions, institutional money market funds, and corporations in which the Company invests its surplus funds. The Company has experienced no credit losses from its cash investments.
Allowance for Doubtful Accounts
The Company records a provision for doubtful accounts based on historical experience and an estimate of the expected credit losses. In estimating the allowance for doubtful accounts, the Company considers, among other factors, the aging of the accounts receivable, its historical write-offs, the credit worthiness of each customer, and general economic conditions. Account balances are charged off against the allowance when the Company believes that it is probable that the receivable will not be recovered. Actual write-offs may be in excess of the Company’s estimated allowance.
Short-term and Long-term Investments
The Company’s short-term and long-term investments consist primarily of investment-grade debt securities, such as U.S. treasury securities, and corporate notes and bonds, all of which are classified as available-for-sale. Available-for-sale securities are carried at fair value. Amortization or accretion of premium or discount is included in other income (expense) on the Consolidated Statements of Operations. Changes in the fair value of available-for-sale securities are reported as a component of accumulated other comprehensive (loss) income within stockholders’ equity on the Consolidated Balance Sheets. Realized gains and losses on the sale of available-for-sale securities are determined by specific identification of the cost basis of each security.
The Company categorizes and classifies short-term and long-term available-for-sale investments on the Company’s Consolidated Balance Sheets as follows:
•Short-term investments: Investments purchased with an original or remaining maturity at time of purchase greater than three months and that are expected to mature within 12 months from the balance sheet date are classified as short-term investments and are presented in current assets.
•Long-term investments: Investments purchased with an original or remaining maturity at time of purchase greater than three months and that are expected to mature more than 12 months from the balance sheet date are classified as long-term investments and are presented in non-current assets.
Inventories
Inventories are stated at the lower of cost (using the first-in, first-out “FIFO” method) or net realizable value. The Company calculates inventory valuation adjustments for excess and obsolete inventory based on current inventory levels, movement, expected useful lives, and estimated future demand of the products and spare parts.
Property and Equipment
Property and equipment is recorded at cost and reduced by accumulated depreciation. Depreciation expense is recognized over the estimated useful lives of the assets using the straight-line method. Estimated useful lives are three to ten years. Certain equipment used in the development and manufacturing of ceramic components is depreciated over estimated useful lives of up to ten years. Leasehold improvements represent remodeling and retrofitting costs for leased office and manufacturing space and are depreciated over the shorter of either the estimated useful lives or the term of the lease. Software purchased for internal use consists primarily of amounts paid for perpetual licenses to third-party software providers and implementation costs. Software is depreciated over the estimated useful lives of three to five years. Maintenance and repairs are charged directly to expense as incurred.
Energy Recovery, Inc. | 2021 Form 10-K Annual Report | 53
ENERGY RECOVERY, INC.
NOTES TO CONSOLIDATED FINANCIAL STATEMENTS
Estimated useful lives are periodically reviewed, and when appropriate, changes are made prospectively. When certain events or changes in operating conditions occur, asset lives may be adjusted and an impairment assessment may be performed on the recoverability of the carrying amounts. The Company evaluates the recoverability of long-lived assets by comparing the carrying amount of an asset to estimated future net undiscounted cash flows generated by the asset (asset group). If such assets are considered to be impaired, the impairment recognized is measured as the amount by which the carrying amount of the assets exceeds the fair value of the assets. The evaluation of recoverability involves estimates of future operating cash flows based upon certain forecasted assumptions, including, but not limited to, revenue growth rates, gross profit margins, and operating expenses.
Leases
The Company determines if an arrangement is a lease, or contains a lease, at the inception of the arrangement and evaluates whether the lease is an operating or a finance lease at the commencement date. The Company recognizes right-of-use (“ROU”) assets and lease liabilities for operating leases with terms greater than 12 months. ROU assets represent the Company’s right to use an asset for the lease term, while lease liabilities represent the Company’s obligation to make lease payments. Operating lease ROU assets and liabilities are recognized based on the present value of lease payments over the lease term at the lease commencement date. The Company uses the implicit interest rate or, if not readily determinable, its incremental borrowing rate as of the lease commencement date to determine the present value of lease payments. The incremental borrowing rate is based on the Company’s unsecured borrowing rate, adjusted for the effects of collateral. Operating lease ROU assets are recognized net of any lease prepayments and incentives. Based on materiality, the Company accounts for both the non-lease components and related lease components as a single lease component. Lease terms may include options to extend or terminate the lease when it is reasonably certain that the Company will exercise that option. Operating lease expense is recognized on a straight-line basis over the lease term.
The Company applies lease modifications that change the contractual terms and conditions of a lease, that were not part of the original lease, and grants additional right of use with a price consistent with the market, as a new lease. These modifications will be assessed in compliance with the above parameters. For other types of lease modification, the modified lease is reassessed and all new assumptions are applied in the calculation of the updated lease liability and the ROU asset.
Goodwill
Goodwill is not amortized but is evaluated annually (July 1) for impairment at the reporting unit level or when indicators of a potential impairment are present. The Company estimates the fair value of the reporting unit using the discounted cash flow and market approaches. The forecast of future cash flows, which is based on the Company’s best estimate of future net sales and operating expenses, is based primarily on expected category expansion, pricing, market segment, and general economic conditions. In addition, the Company incorporates other significant inputs to its fair value calculations, including discount rate and market multiples, to reflect current market conditions, and also considered the impact of the COVID-19 pandemic in its calculations.
Fair Value of Financial Instruments
The Company’s financial instruments include cash and cash equivalents, restricted cash, investments in marketable securities, accounts receivable, and accounts payable. The carrying amounts for these financial instruments reported in the Consolidated Balance Sheets approximate their fair values. See Note 5, “Investments and Fair Value Measurements,” for further discussion related to fair value.
Revenue Recognition
Revenues are recognized when control of the promised goods or services is transferred to the Company’s customers, in an amount that reflects the consideration the Company expects to be entitled to in exchange for those goods or services. At the inception of each contract, performance obligations are identified and the total transaction price is allocated to the performance obligations.
Energy Recovery, Inc. | 2021 Form 10-K Annual Report | 54
ENERGY RECOVERY, INC.
NOTES TO CONSOLIDATED FINANCIAL STATEMENTS
The Company’s payment terms vary based on the credit risk of its customer. For certain customer types, the Company requires payment before the products or services are delivered to the customer. The Company performs an evaluation of customer credit worthiness on an individual contract basis to assess whether collectability is reasonably assured at the inception of the contract. As part of this evaluation, the Company considers many factors about the individual customer, including the underlying financial strength of the customer and/or partnership consortium and the Company’s prior history or industry-specific knowledge about the customer and its supplier relationships. For smaller projects, the Company requires the customer to remit payment generally within 30 to 60 days after product delivery. In some cases, if credit worthiness cannot be determined, prepayment or other security is required.
Sales commissions are expensed as incurred when product revenue is earned. These costs are recorded within sales and marketing expenses.
Arrangements with Multiple Performance Obligations and Termination for Convenience
The Company’s contracts with customers may include multiple performance obligations. For such arrangements, the Company allocates revenue to each performance obligation based on its relative stand-alone selling price. The Company generally determines stand-alone selling prices based on the prices charged to customers.
With respect to termination, the Company does not have the ability to cancel the contract for convenience. In general, customers can cancel for convenience upon the payment of a termination fee that covers costs and profit. It is rare for customers to cancel contracts.
Practical Expedients and Exemptions
In the Water segment, the time period between when the Company transfers control of products to the customer and the payment for the products is, in general, less than one year and, therefore, the practical expedient with respect to a financing component has been adopted by the Company.
With respect to taxes, the Company has made the policy election to exclude taxes from the measurement of the transaction price.
The Company does not disclose the value of unsatisfied performance obligations for (i) contracts with an original expected length of one year or less; and (ii) contracts for which the Company recognizes revenue at the amount to which the Company has the right to invoice for services performed.
Contract Costs
The Company recognizes the incremental cost of obtaining contracts as an expense when incurred if the amortization period of the assets that the Company otherwise would have recognized is one year or less. The costs of obtaining contracts are included in sales and marketing expenses.
Product and Service Revenue Recognition - Water Segment
In the Company’s Water segment, a contract is established by a written agreement (executed sales order, executed purchase order or stand-alone contract) with the customer with fixed pricing, and a credit risk assessment is completed prior to the signing of the agreement to ensure that collectability is reasonably assured.
The Company adheres to consistent pricing in the stand-alone sale of products and services. The Company does not generally bundle performance obligations in the Water segment. Performance obligations consist of delivery of products, such as the Company’s PXs, hydraulic turbochargers (“Turbochargers”), pumps and spare parts, and services. Service obligations, such as commissioning, which are not material, are deferred as contract liabilities until the services are performed.
Energy Recovery, Inc. | 2021 Form 10-K Annual Report | 55
ENERGY RECOVERY, INC.
NOTES TO CONSOLIDATED FINANCIAL STATEMENTS
The transfer of control for the Company’s products follows transfer of title which typically occurs upon shipment or delivery of the equipment in accordance with International Commercial Terms (commonly referred to as “incoterms”). The specified product performance criteria for the Company’s products pertain to the ability of the Company’s product to meet its published performance specifications and warranty provisions, which the Company’s products have demonstrated on a consistent basis. This factor, combined with historical performance metrics, provides the Company’s management with a reasonable basis to conclude that the products will perform satisfactorily upon commissioning of the plant. Installation is relatively simple, requires no customization, and is performed by the customer under the supervision of the Company’s personnel. Based on these factors, the Company concluded that performance has been completed upon shipment or delivery when title transfers based on the shipping terms, and that product revenue is recognized at a point in time.
The Company does not provide its customers with a right of product return; however, the Company will accept returns of products that are deemed to be damaged or defective when delivered that are covered by the terms and conditions of the product warranty. Product warranty is provided consistent with the industry and is considered to be an assurance warranty, not a separate performance obligation. Product returns and warranty charges have not been significant.
For large projects, stand-alone contracts are utilized. For these contracts, consistent with industry practice, the Company’s customers typically require their suppliers, including the Company, to accept contractual holdback provisions (also referred to as a retention payment) whereby the final amounts due under the sales contract are remitted over extended periods of time or alternatively, stand-by letters of credit are issued. These retention payments are generally 10% or less of the total contract amount and are due and payable based upon the contractual milestone billing, generally up to 24 to 36 months from the date of product delivery. These retention payments with performance conditions are recorded as contract assets and align with the product warranty period. Given that they are not material in the context of the contract, they are not considered to be a financing component.
Shipping and handling charges billed to customers are pass-through from the freight forwarder to the customer and are included in product revenue. The cost of shipping to customers is included in product cost of revenue.
License and Development Revenue Recognition - Emerging Technologies Segment
Revenue is recognized when control of the promised goods or services is transferred to customers. For example, stand-alone selling price was established at the inception of a license agreement by taking the transaction to market on a non-exclusive basis, and pricing in an exclusivity premium. Since the license agreement included an up-front non-refundable payment at the inception and future products and services are provided after initial commercialization, the Company completed an analysis and concluded that there was no material right included in the pricing of the license agreement. Performance obligations, such as the exclusive license to the Company’s missile technology and upgrades prior to and subsequent to the date of full commercial launch, have been identified. Value has been allocated to the performance obligations and license and development revenue is recognized over time based on the input measure of progress of the cost of salaries, wages and travel costs related to the project prior to full commercialization, and ratably for the unspecified upgrades for the period subsequent to full commercialization until the expiration of the license agreement. In June 2020, the license agreement was terminated and all unrecognized future revenue under the license agreement was recognized in the second quarter of fiscal year 2020.
Contracts are sometimes modified for a change in scope or other requirements. The Company considers contract modifications to exist when the modification either creates new or changes the existing enforceable rights and obligations. Any subsequent contract modifications are analyzed to determine the treatment of the contract modification as a separate contract, prospectively or through a cumulative catch-up adjustment.
Warranty Costs
The Company sells products with a limited warranty for a period ranging from 18 months to five years. The Company accrues for warranty costs based on estimated product failure rates, historical activity, and expectations of future costs. Periodically, the Company evaluates and adjusts the warranty costs to the extent that actual warranty costs vary from the original estimates.
Energy Recovery, Inc. | 2021 Form 10-K Annual Report | 56
ENERGY RECOVERY, INC.
NOTES TO CONSOLIDATED FINANCIAL STATEMENTS
Stock-based Compensation
The Company measures and recognizes stock-based compensation expense based on the fair value measurement for all stock-based awards made to its employees, non-employee consultants and directors, including restricted stock units (“RSUs”), and incentive stock options over the requisite service period (typically the vesting period of the awards). The fair value of RSUs is based on the Company’s common stock price on the date of grant. The fair value of stock options is calculated on the date of grant using the Black-Scholes (aka the “Black-Scholes-Merton”) model, which requires a number of complex assumptions including the expected life to exercise a vested award based upon the Company’s exercise history, expected volatility based upon the Company’s historical stock prices, risk-free interest rate based upon the U.S. Treasury rates, and the Company’s dividend yield. The estimation of awards that will ultimately vest requires judgment, and to the extent that actual results or updated estimates differ from the Company’s current estimates, such amounts are recorded as a cumulative adjustment in the period in which the estimates are revised. See Note 10, “Stock-based Compensation,” for further discussion of stock-based compensation.
Foreign Currency
The Company’s reporting currency is the U.S. dollar. The functional currency of the Company’s foreign subsidiaries is their respective local currencies. The asset and liability accounts of the Company’s foreign subsidiaries are translated from their local currencies at the rates in effect on the balance sheet date. Revenue and expenses are translated at average rates of exchange prevailing during the period. Gains and losses resulting from the translation of the Company’s subsidiary balance sheets are recorded as a component of accumulated other comprehensive income (loss). Gains and losses from foreign currency transactions are recorded in other income (expense) in the Consolidated Statements of Operations.
Income Taxes
Current and non-current tax assets and liabilities are based upon an estimate of taxes refundable or payable for each of the jurisdictions in which the Company is subject to tax. In the ordinary course of business, there is inherent uncertainty in quantifying income tax positions. The Company assesses income tax positions and records tax benefits for all years subject to examination based upon the Company’s evaluation of the facts, circumstances, and information available at the reporting dates. For those tax positions where it is more likely than not that a tax benefit will be sustained, the Company records the largest amount of tax benefit with a greater than 50% likelihood of being realized upon ultimate settlement with a taxing authority that has full knowledge of all relevant information. For those income tax positions where it is not more likely than not that a tax benefit will be sustained, no tax benefit is recognized in the financial statements. When applicable, associated interest and penalties are recognized as a component of income tax expense. Accrued interest and penalties are included within the related tax asset or liability on the Consolidated Balance Sheets.
Deferred income taxes are provided for temporary differences arising from differences in bases of assets and liabilities for tax and financial reporting purposes. Deferred income taxes are recorded on temporary differences using enacted tax rates in effect for the year in which the temporary differences are expected to reverse. The effect of a change in tax rates on deferred tax assets and liabilities is recognized in income in the period that includes the enactment date. Deferred tax assets are reduced by a valuation allowance when, in the opinion of management, it is more likely than not that some portion or all of the deferred tax assets will not be realized. Significant judgment is required in determining whether and to what extent any valuation allowance is needed on the Company’s deferred tax assets. In making such a determination, the Company considers all available positive and negative evidence including recent results of operations, scheduled reversals of deferred tax liabilities, projected future income, and available tax planning strategies. See Note 8, “Income Taxes,” for further discussion of tax valuation allowances.
The Company’s operations are subject to income and transaction taxes in the U.S. and in foreign jurisdictions. Significant estimates and judgments are required in determining the Company’s worldwide provision for income taxes. Some of these estimates are based on interpretations of existing tax laws or regulations. The ultimate amount of tax liability may be uncertain as a result.
Energy Recovery, Inc. | 2021 Form 10-K Annual Report | 57
ENERGY RECOVERY, INC.
NOTES TO CONSOLIDATED FINANCIAL STATEMENTS
Recently Adopted Accounting Pronouncement
In December 2019, the Financial Accounting Standards Board (“FASB”) issued Accounting Standards Update (“ASU”) No. 2019-12, Income Taxes (Topic 740): Simplifying the Accounting for Income Taxes (“ASU 2019-12”), which simplifies the accounting for income taxes by removing certain exceptions to the general principles in Topic 740 and also clarifies and amends existing guidance to improve consistent application. The new standard is effective for interim and annual periods beginning after December 15, 2020. The Company adopted ASU 2019-12 on January 1, 2021. The adoption of ASU 2019-12 did not have a material impact on the Company’s consolidated financial condition, results of operations, and cash flows.
Recently Issued Accounting Pronouncement Not Yet Adopted
In March 2020, the FASB issued ASU No. 2020-04, Reference Rate Reform (Topic 848) (“ASU 2020-04”), which provided optional expedients and exceptions for applying U.S. GAAP to contracts, hedging relationships, and other transactions affected by the discontinuation of the London Interbank Offered Rate (“LIBOR”) or by another reference rate expected to be discontinued. The FASB later issued ASU No. 2021-01, Reference Rate Reform (Topic 848): Scope, to clarify the scope of Topic 848 so that derivatives affected by the discounting transition are explicitly eligible for certain optional expedients and exceptions in Topic 848 (“ASU 2021-01”). Entities may apply the provisions of the new standards as of the beginning of the reporting period when the election is made (i.e., as early as the first quarter of 2020). Unlike other topics, the provisions of this update are only available until December 31, 2022, when the reference rate replacement activity is expected to have been completed. An entity may elect to apply amendments prospectively through December 31, 2022. The optional expedients were available to be used upon issuance of this guidance but the Company has not yet applied the guidance because the Company has not yet modified its existing contract for reference rate reform. The Company does not expect the provisions of ASU 2020-04 or ASU 2021-01 to have a material impact on its financial condition, results of operation, and cash flows.
Energy Recovery, Inc. | 2021 Form 10-K Annual Report | 58
ENERGY RECOVERY, INC.
NOTES TO CONSOLIDATED FINANCIAL STATEMENTS
Note 2 — Revenue
Disaggregated Revenue
The Company classifies its channel customers as follows:
•Megaproject (“MPD”). MPD customers are major firms that develop, design, build, own and/or operate large-scale desalination plants.
•Original Equipment Manufacturer (“OEM”). OEM customers are companies that supply equipment, packaged systems, and various operating and maintenance solutions for small to medium-sized desalination plants, utilized by commercial and industrial entities, as well as national, state and local municipalities worldwide.
•Aftermarket (“AM”). AM customers are desalination plant owners and/or operators who can utilize our technology to upgrade or keep their plant running.
The following tables present the Company’s disaggregated revenues by product and service line, revenues by geography based on the “shipped to” addresses of the Company’s customers, product revenue by channel, and product revenue by segment (Water and Emerging Technologies segments). Sales and usage-based taxes are excluded from revenues. See Note 11, “Segment Reporting,” for definition of segments.
| | | | | | | | | | | | | | | | | | | | | | | | | | | | | | | | | | | | | | | | | | | | | | | | | | | | | |
| Year Ended December 31, 2021 | | Year Ended December 31, 2020 | | Year Ended December 31, 2019 |
| Water | | Emerging Technologies | | Total | | Water | | Emerging Technologies | | Total | | Water | | Emerging Technologies | | Total |
| (In thousands) |
| Revenue by product and service line |
| PXs, turbochargers, pumps and other devices | $ | 103,851 | | | $ | 53 | | | $ | 103,904 | | | $ | 92,061 | | | $ | 30 | | | $ | 92,091 | | | $ | 72,730 | | | $ | 104 | | | $ | 72,834 | |
| | | | | | | | | | | | | | | | | |
| License and development | — | | | — | | | — | | | — | | | 26,895 | | | 26,895 | | | — | | | 14,108 | | | 14,108 | |
| | | | | | | | | | | | | | | | | |
| | | | | | | | | | | | | | | | | |
| Total revenue | $ | 103,851 | | | $ | 53 | | | $ | 103,904 | | | $ | 92,061 | | | $ | 26,925 | | | $ | 118,986 | | | $ | 72,730 | | | $ | 14,212 | | | $ | 86,942 | |
| | | | | | | | | | | | | | | | | |
| Revenue by primary geographical markets |
| Middle East and Africa | $ | 78,348 | | | $ | 53 | | | $ | 78,401 | | | $ | 73,963 | | | $ | — | | | $ | 73,963 | | | $ | 46,574 | | | $ | 104 | | | $ | 46,678 | |
| Asia | 18,639 | | | — | | | 18,639 | | | 7,363 | | | — | | | 7,363 | | | 11,952 | | | — | | | 11,952 | |
| Europe | 3,600 | | | — | | | 3,600 | | | 3,461 | | | — | | | 3,461 | | | 5,186 | | | — | | | 5,186 | |
| Americas | 3,264 | | | — | | | 3,264 | | | 7,274 | | | 26,925 | | | 34,199 | | | 9,018 | | | 14,108 | | | 23,126 | |
| | | | | | | | | | | | | | | | | |
| Total revenue | $ | 103,851 | | | $ | 53 | | | $ | 103,904 | | | $ | 92,061 | | | $ | 26,925 | | | $ | 118,986 | | | $ | 72,730 | | | $ | 14,212 | | | $ | 86,942 | |
| | | | | | | | | | | | | | | | | |
| Product revenue by channel |
| Megaproject | $ | 75,338 | | | $ | 53 | | | $ | 75,391 | | | $ | 66,763 | | | $ | — | | | $ | 66,763 | | | $ | 38,164 | | | $ | — | | | $ | 38,164 | |
| Original equipment manufacturer | 17,604 | | | — | | | 17,604 | | | 15,834 | | | — | | | 15,834 | | | 23,014 | | | — | | | 23,014 | |
| Aftermarket | 10,909 | | | — | | | 10,909 | | | 9,464 | | | 30 | | | 9,494 | | | 11,552 | | | 104 | | | 11,656 | |
| | | | | | | | | | | | | | | | | |
| Total product revenue | $ | 103,851 | | | $ | 53 | | | $ | 103,904 | | | $ | 92,061 | | | $ | 30 | | | $ | 92,091 | | | $ | 72,730 | | | $ | 104 | | | $ | 72,834 | |
Energy Recovery, Inc. | 2021 Form 10-K Annual Report | 59
ENERGY RECOVERY, INC.
NOTES TO CONSOLIDATED FINANCIAL STATEMENTS
On June 24, 2020, the Company entered into an agreement with Schlumberger Technology Corporation (“Schlumberger”) to terminate the existing 2015 license agreement between the Company and Schlumberger to provide Schlumberger with the exclusive worldwide rights to the VorTeq technology (“VorTeq License Agreement”). Pursuant to the terms of the agreement, each party’s rights, duties and obligations under the VorTeq License Agreement have been terminated effective June 1, 2020. Accordingly, the Company (i) is entitled to retain all of the non-refundable upfront exclusivity payment; (ii) is not entitled to any further payments from Schlumberger; and (iii) has no future performance obligations under the VorTeq License Agreement. The Company accounted for the termination as a contract modification, which resulted in the Company recognizing the remaining amounts of the original $75.0 million non-refundable upfront exclusivity payment of $24.4 million during the second quarter of fiscal year 2020 as license and development revenue in the Consolidated Statements of Operations for such quarter.
Contract Balances
The following table presents contract balances by category.
| | | | | | | | | | | |
| December 31, |
| 2021 | | 2020 |
| (In thousands) |
| Accounts receivable, net | $ | 20,615 | | | $ | 11,792 | |
| Contract assets: | | | |
| Contract assets, current (included in prepaid expenses and other assets) | $ | 493 | | | $ | 1,309 | |
| Contract assets, non-current (included in other assets, non-current) | — | | | 583 | |
| Total contract assets | $ | 493 | | | $ | 1,892 | |
| | | |
| Contract liabilities: | | | |
| | | |
| | | |
| | | |
| | | |
| | | |
| | | |
| | | |
| | | |
| Contract liabilities, current | $ | 3,318 | | | $ | 1,552 | |
| | | |
| | | |
| | | |
| | | |
| | | |
| | | |
| | | |
| Contract liabilities, non-current (included in other liabilities, non-current) | 88 | | | 88 | |
| Total contract liabilities | $ | 3,406 | | | $ | 1,640 | |
Contract Liabilities
The Company records contract liabilities, which consist of customer deposits and deferred revenue, when cash payments are received in advance of the Company’s performance. The following table presents significant changes in contract liabilities during the period.
| | | | | | | | | | | | | | | | | | | | | |
| | | Years Ended December 31, |
| | | | | 2021 | | 2020 | | 2019 |
| | | | | (In thousands) |
| Contract liabilities, beginning of year | | | | | $ | 1,640 | | | $ | 28,866 | | | $ | 42,809 | |
| Revenue recognized | | | | | (1,415) | | | (28,414) | | | (15,247) | |
| Cash received, excluding amounts recognized as revenue during the period | | | | | 3,181 | | | 1,188 | | | 1,304 | |
| Contract liabilities, end of year | | | | | $ | 3,406 | | | $ | 1,640 | | | $ | 28,866 | |
Future Performance Obligations
The following table presents the future estimated revenue by year expected to be recognized related to performance obligations that are unsatisfied or partially unsatisfied.
| | | | | | | | |
| Year Recognized | | December 31,
2021 |
| | (In thousands) |
| 2022 | | $ | 12,284 | |
| | |
| | |
| | |
| | |
| | |
Energy Recovery, Inc. | 2021 Form 10-K Annual Report | 60
ENERGY RECOVERY, INC.
NOTES TO CONSOLIDATED FINANCIAL STATEMENTS
Note 3 — Net Income Per Share
Net income for the reported period is divided by the weighted average number of common shares outstanding during the reported period to calculate basic net income per common share.
•Basic net income per common share excludes any dilutive effect of stock options and RSUs.
•Diluted net income per common share reflects the potential dilution that would occur if outstanding stock options to purchase common stock were exercised for shares of common stock, using the treasury stock method, and the shares of common stock underlying each unvested RSU were issued.
Outstanding stock options to purchase common stock and unvested RSUs are collectively referred to as “stock awards.”
The following table presents the computation of basic and diluted net income per common share.
| | | | | | | | | | | | | | | | | | | | | |
| | | | Years Ended December 31, |
| | | | | | 2021 | | 2020 | | 2019 |
| | | | | (In thousands, except per share amounts) |
| Numerator | | | | | | | | | |
| Net income | | | | | $ | 14,269 | | | $ | 26,387 | | | $ | 10,913 | |
| | | | | | | | | |
| Denominator (weighted average shares) | | | | | | | | | |
| Basic common shares outstanding | | | | | 56,993 | | | 55,709 | | | 54,740 | |
| Dilutive stock awards | | | | | 1,730 | | | 928 | | | 1,327 | |
| Diluted common shares outstanding | | | | | 58,723 | | | 56,637 | | | 56,067 | |
| | | | | | | | | |
| Net income per share | | | | | | | | | |
| Basic | | | | | $ | 0.25 | | | $ | 0.47 | | | $ | 0.20 | |
| Diluted | | | | | $ | 0.24 | | | $ | 0.47 | | | $ | 0.19 | |
Certain shares of common stock issuable under stock awards have been omitted from the diluted net income per common share calculations because their inclusion is considered anti-dilutive. The following table presents the weighted potential common shares issuable under stock awards that were excluded from the computation of diluted net income per common share.
| | | | | | | | | | | | | | | | | | | | | |
| | | | Years Ended December 31, |
| | | | | | 2021 | | 2020 | | 2019 |
| | | | | (In thousands) |
| | | | | | | | | |
| | | | | | | | | |
| Anti-dilutive stock award shares | | | | | 17 | | | 2,185 | | | 1,898 | |
| | | | | | | | | |
Energy Recovery, Inc. | 2021 Form 10-K Annual Report | 61
ENERGY RECOVERY, INC.
NOTES TO CONSOLIDATED FINANCIAL STATEMENTS
Note 4 — Other Financial Information
Cash, Cash Equivalents and Restricted Cash
The Consolidated Statements of Cash Flows explain the changes in the total of cash, cash equivalents and restricted cash. The following table presents a reconciliation of cash, cash equivalents and restricted cash(1) reported within the Consolidated Balance Sheets that sum to the total of such amounts presented.
| | | | | | | | | | | | | | | | | | | |
| December 31, |
| 2021 | | 2020 | | | | 2019 |
| (In thousands) |
| Cash and cash equivalents | $ | 74,358 | | | $ | 94,255 | | | | | $ | 26,387 | |
| | | | | | | |
| Restricted cash, non-current (included in other assets, non-current, non-current) | 103 | | | 103 | | | | | 101 | |
| Total cash, cash equivalents and restricted cash | $ | 74,461 | | | $ | 94,358 | | | | | $ | 26,488 | |
(1) The Company pledged and deposited cash amounts into restricted cash accounts in connection with the Company’s credit cards.
Accounts Receivable, net
The following table presents the components of accounts receivable, net.
| | | | | | | | | | | |
| December 31, |
| | 2021 | | 2020 |
| (In thousands) |
| Accounts receivable, gross | $ | 20,732 | | | $ | 12,189 | |
| Allowance for doubtful accounts | (117) | | | (397) | |
| Accounts receivable, net | $ | 20,615 | | | $ | 11,792 | |
Allowance for Doubtful Accounts
The following table presents the allowance for doubtful accounts activities.
| | | | | | | | | | | | | | | | | | | | | |
| | | Years Ended December 31, |
| | | | | 2021 | | 2020 | | 2019 |
| | | | | (In thousands) |
| Balance, beginning of year | | | | | $ | 397 | | | $ | 308 | | | $ | 396 | |
Changes to reserves (1) | | | | | — | | | 95 | | | 17 | |
| Collection of specific reserves | | | | | — | | | (6) | | | (105) | |
Uncollectible accounts written off, net of recoveries (2) | | | | | (280) | | | — | | | — | |
| Balance, end of year | | | | | $ | 117 | | | $ | 397 | | | $ | 308 | |
| | | | | | | | | |
| | | | | | | | | |
| | | | | | | | | |
(1)General and specific reserves charged to expense.
(2)The Company wrote-off $0.3 million of uncollectible receivables which had been previously reserved.
Energy Recovery, Inc. | 2021 Form 10-K Annual Report | 62
ENERGY RECOVERY, INC.
NOTES TO CONSOLIDATED FINANCIAL STATEMENTS
Inventories, net
Inventories are stated at the lower of cost or net realizable value, using the first-in, first-out method. The following table presents gross inventory by category and reconciliation to net inventory.
| | | | | | | | | | | |
| December 31, |
| | 2021 | | 2020 |
| (In thousands) |
| Raw materials | $ | 7,352 | | | $ | 4,647 | |
| Work in process | 3,406 | | | 2,475 | |
| Finished goods | 10,274 | | | 5,160 | |
| Inventories, gross | 21,032 | | | 12,282 | |
| Valuation adjustments for excess and obsolete inventory | (649) | | | (534) | |
| Inventories, net | $ | 20,383 | | | $ | 11,748 | |
| | | |
| | | |
Prepaid Expenses and Other Assets
| | | | | | | | | | | |
| December 31, |
| | 2021 | | 2020 |
| (In thousands) |
| Contract assets | $ | 493 | | | $ | 1,309 | |
| Cloud computing arrangement implementation costs | 1,041 | | | 1,087 | |
| Supplier advances | 1,717 | | | 996 | |
| | | |
| | | |
| | | |
| | | |
| | | |
| | | |
| Other prepaid expenses and other assets | 1,824 | | | 1,558 | |
| Total prepaid expenses and other assets | $ | 5,075 | | | $ | 4,950 | |
| | | |
| | | |
| | | |
| | | |
| | | |
| | | |
| | | |
| | | |
| | | |
| | | |
| | | |
| | | |
The following table presents the cloud computing arrangement amortization expense. The Company placed its cloud computing arrangements in service in fiscal year 2020, therefore, during the year ended December 31, 2019 there was no cloud computing amortization expense.
| | | | | | | | | | | | | | | | | |
| | | Years Ended December 31, |
| | | | | 2021 | | 2020 | | |
| | | | | (In thousands) |
| Amortization expense | | | | | $ | 296 | | | $ | 190 | | | |
| | | | | | | | | |
Energy Recovery, Inc. | 2021 Form 10-K Annual Report | 63
ENERGY RECOVERY, INC.
NOTES TO CONSOLIDATED FINANCIAL STATEMENTS
Property and Equipment
| | | | | | | | | | | |
| December 31, |
| | 2021 | | 2020 |
| (In thousands) |
| Machinery and equipment | $ | 29,777 | | | $ | 30,283 | |
| Leasehold improvements | 15,224 | | | 14,520 | |
| Software | 3,300 | | | 3,422 | |
| Office equipment, furniture, and fixtures | 2,890 | | | 3,493 | |
| Automobiles | 240 | | | 199 | |
| Construction in progress | 3,296 | | | 670 | |
| Total property and equipment | 54,727 | | | 52,587 | |
| Less: Accumulated depreciation and amortization | (34,366) | | | (32,411) | |
| Total property and equipment, net | $ | 20,361 | | | $ | 20,176 | |
| | | |
| | | |
| | | | | | | | | | | | | | | | | | | | | |
| | | | Years Ended December 31, |
| | | | | | 2021 | | 2020 | | 2019 |
| | | | | (In thousands) |
| Depreciation and amortization expense | | | | | $ | 4,490 | | | $ | 3,875 | | | $ | 3,820 | |
| | | | | | | | | |
Goodwill and Other Intangible Assets
| | | | | | | | | | | |
| December 31, |
| 2021 | | 2020 |
| (In thousands) |
| Goodwill | $ | 12,790 | | | $ | 12,790 | |
| Other intangible assets | | | |
| Other intangible assets, gross | 193 | | | 286 | |
| Accumulated amortization | (156) | | | (237) | |
| Other intangible assets, net | 37 | | | 49 | |
| Total goodwill and other intangible assets | $ | 12,827 | | | $ | 12,839 | |
| | | |
Goodwill
Goodwill is tested for impairment annually in the third quarter of the Company’s fiscal year or more frequently if indicators of potential impairment exist. The recoverability of goodwill is measured at the reporting unit level, which represents the operating segment.
On July 1, 2021, the Company estimated the fair value of its reporting units using both the discounted cash flow and market approaches. The forecast of future cash flows, which is based on the Company’s best estimate of future net sales and operating expenses, is based primarily on expected category expansion, pricing, market segment, and general economic conditions. The Company incorporates other significant inputs to its fair value calculations, including discount rate and market multiples, to reflect current market conditions. The analysis performed indicated that the fair value of each reporting unit that is allocated goodwill significantly exceeds its carrying value. As a result, no impairment charge was recorded during the year ended December 31, 2021. The Company continues to actively monitor the industries in which it operates and its business performance for indicators of potential impairment.
Other Intangible Assets
Other intangible assets represents patents acquired. Gross other intangible assets and related accumulated amortization balances at December 31, 2021 were reduced due to the retirement of a fully amortized patent asset during the year ended December 31, 2021. There was no impairment of intangible assets recorded during the years ended December 31, 2021, 2020 and 2019. Other intangible assets are amortized on a straight-line basis. As of December 31, 2021, the remaining other intangible asset carrying value will be amortized over the remaining life of 3.3 years.
Energy Recovery, Inc. | 2021 Form 10-K Annual Report | 64
ENERGY RECOVERY, INC.
NOTES TO CONSOLIDATED FINANCIAL STATEMENTS
Accrued Expenses and Other Liabilities
| | | | | | | | | | | |
| December 31, |
| | 2021 | | 2020 |
| (In thousands) |
| Current | | | |
| Payroll, incentives and commissions payable | $ | 10,170 | | | $ | 8,400 | |
| Warranty reserve | 879 | | | 760 | |
| | | |
| | | |
| | | |
| | | |
| | | |
| | | |
| | | |
| | | |
| | | |
| Other accrued expenses and other liabilities | 2,945 | | | 2,656 | |
| Total accrued expenses and other liabilities | 13,994 | | | 11,816 | |
| | | |
| | | |
| | | |
| | | |
| | | |
| | | |
| | | |
| | | |
| | | |
| | | |
| | | |
| | | |
| | | |
| Other liabilities, non-current | 247 | | | 518 | |
| Total accrued expenses, and current and non-current other liabilities | $ | 14,241 | | | $ | 12,334 | |
Accumulated Other Comprehensive (Loss) Income
There were no reclassifications of amounts out of accumulated other comprehensive (loss) income for the years ended December 31, 2021, 2020, and 2019, as there have been no sales of securities or translation adjustments that impacted other comprehensive (loss) income during these periods. The tax impact of the changes in accumulated other comprehensive (loss) income for the years ended December 31, 2021, 2020 and 2019, was not material.
Advertising Expense
Advertising expense is charged to operations during the year in which it is incurred. Total advertising expense was not material for the years ended December 31, 2021, 2020 and 2019.
Energy Recovery, Inc. | 2021 Form 10-K Annual Report | 65
ENERGY RECOVERY, INC.
NOTES TO CONSOLIDATED FINANCIAL STATEMENTS
Note 5 — Investments and Fair Value Measurements
Available-for-Sale Investments
The Company’s investments in investment-grade short-term and long-term high-quality marketable debt instruments, such as U.S. treasury securities, and corporate notes and bonds, are classified as available-for-sale. As of December 31, 2021 and 2020, available-for-sale investments were classified on the Consolidated Balance Sheets as either short-term and/or long-term investments.
The classification of available-for-sale investments on the Consolidated Balance Sheets and definition of each of these classifications are presented in Note 1, “Description of Business and Significant Accounting Policies - Significant Accounting Policies,” subsections “Cash and Cash Equivalents” and “Short-term and Long-term Investments.”
Expected maturities can differ from contractual maturities because borrowers may have the right to prepay obligations without prepayment penalties. The Company generally holds available-for-sale investments until maturity; however, from time-to-time, the Company may elect to sell certain available-for-sale investments prior to contractual maturity.
Fair Value of Financial Instruments
The Company follows the authoritative guidance for fair value measurements and disclosures that, among other things, defines fair value, establishes a consistent framework for measuring fair value, and expands disclosure for each major asset and liability category measured at fair value on either a recurring or nonrecurring basis. Fair value is defined as an exit price that would be received to sell an asset or paid to transfer a liability in an orderly transaction between market participants. As such, fair value is a market-based measurement that should be determined based on assumptions that market participants would use in pricing an asset or liability.
All of the Company’s financial assets and liabilities are remeasured and reported at fair value at each reporting period, and are classified and disclosed in one of the following three pricing category levels:
Level 1 — Quoted prices (unadjusted) in active markets for identical assets or liabilities;
Level 2 — Inputs other than quoted prices included within Level 1 that are either directly or indirectly observable; and
Level 3 — Unobservable inputs in which little or no market activity exists, thereby requiring an entity to develop its own assumptions that market participants would use in pricing.
Energy Recovery, Inc. | 2021 Form 10-K Annual Report | 66
ENERGY RECOVERY, INC.
NOTES TO CONSOLIDATED FINANCIAL STATEMENTS
The following table presents the Company’s financial assets measured on a recurring basis by contractual maturity, including pricing category, amortized cost, gross unrealized gains and losses, and fair value.
| | | | | | | | | | | | | | | | | | | | | | | | | | | | | | | | | | | | | | | | | | | | | | | | | | | | | | | | |
| | | | | | December 31, 2021 | | December 31, 2020 |
| | | | Pricing Category | | Amortized
Cost | | Gross
Unrealized
Gains | | Gross
Unrealized
Losses | | Fair
Value | | Amortized
Cost | | Gross
Unrealized
Gains | | Gross
Unrealized
Losses | | Fair
Value |
| | | | | | (In thousands) |
| Cash equivalents | | | | | | | | | | | | | | | | |
| Money market securities | | | | Level 1 | | $ | 50,865 | | | $ | — | | | $ | — | | | $ | 50,865 | | | $ | 59,132 | | | $ | — | | | $ | — | | | $ | 59,132 | |
| | | | | | | | | | | | | | | | | | | | |
| | | | | | | | | | | | | | | | | | | | |
| | | | | | | | | | | | | | | | | | | | |
| | | | | | | | | | | | | | | | | | | | |
| Total cash equivalents | | | | | | 50,865 | | | — | | | — | | | 50,865 | | | 59,132 | | | — | | | — | | | 59,132 | |
| | | | | | | | | | | | | | | | | | | | |
| Short-term investments | | | | | | | | | | | | | | | | |
| U.S. treasury securities | | | | Level 2 | | — | | | — | | | — | | | — | | | 1,614 | | | 7 | | | — | | | 1,621 | |
| | | | | | | | | | | | | | | | | | | | |
| Corporate notes and bonds | | | | Level 2 | | 31,371 | | | — | | | (39) | | | 31,332 | | | 18,708 | | | 117 | | | — | | | 18,825 | |
| | | | | | | | | | | | | | | | | | | | |
| Total short-term investments | | | | | | 31,371 | | | — | | | (39) | | | 31,332 | | | 20,322 | | | 124 | | | — | | | 20,446 | |
| | | | | | | | | | | | | | | | | | | | |
| Long-term investments | | | | | | | | | | | | | | | | |
| | | | | | | | | | | | | | | | | | | | |
| | | | | | | | | | | | | | | | | | | | |
| Corporate notes and bonds | | | | Level 2 | | 2,307 | | | — | | | (9) | | | 2,298 | | | — | | | — | | | — | | | — | |
| | | | | | | | | | | | | | | | | | | | |
| Total long-term investments | | | | | | 2,307 | | | — | | | (9) | | | 2,298 | | | — | | | — | | | — | | | — | |
| Total short and long-term investments | | | | | | 33,678 | | | — | | | (48) | | | 33,630 | | | 20,322 | | | 124 | | | — | | | 20,446 | |
| Total | | | | | | $ | 84,543 | | | $ | — | | | $ | (48) | | | $ | 84,495 | | | $ | 79,454 | | | $ | 124 | | | $ | — | | | $ | 79,578 | |
| | | | | | | | | | | | | | | | | | | | |
As of December 31, 2021 and 2020, the Company had no financial liabilities and no Level 3 financial assets. During the year ended December 31, 2021, the Company had no transfers of financial assets between any levels.
The following table presents a summary of the fair value and gross unrealized losses on the available-for-sale securities that have been in a continuous unrealized loss position, aggregated by type of investment instrument. The available-for-sale securities that were in an unrealized gain position have been excluded from the table.
| | | | | | | | | | | | | | | | | | | | | | | |
| | December 31, 2021 | | December 31, 2020 |
| | Fair
Value | | Gross
Unrealized
Losses | | Fair
Value | | Gross
Unrealized
Losses |
| (In thousands) |
| | | | | | | |
| | | | | | | |
| Corporate notes and bonds | $ | 33,630 | | | $ | (48) | | | $ | — | | | $ | — | |
| | | | | | | |
| | | | | | | |
Sales of Available-for-Sale Investments
The following table presents the sales of available-for-sale investments.
| | | | | | | | | | | | | | | | | |
| | | | Years Ended December 31, |
| | | | | | 2021 | | 2020 | | |
| | | | | (In thousands) |
| | | | | | | | | |
| | | | | | | | | |
| | | | | | | | | |
| Corporate notes and bonds | | | | | $ | — | | | $ | 10,573 | | | |
| | | | | | | | | |
| | | | | | | | | |
| | | | | | | | | |
| | | | | | | | | |
| | | | | | | | | |
| | | | | | | | | |
| | | | | | | | | |
| | | | | | | | | |
| | | | | | | | | |
| | | | | | | | | |
| | | | | | | | | |
| | | | | | | | | |
Realized gains or losses on sales of securities were immaterial during the years ended December 31, 2021, 2020 and 2019.
Energy Recovery, Inc. | 2021 Form 10-K Annual Report | 67
ENERGY RECOVERY, INC.
NOTES TO CONSOLIDATED FINANCIAL STATEMENTS
Note 6 — Lines of Credit
Credit Agreement
The Company entered into a credit agreement with JPMorgan Chase Bank, N.A. (“JPMC”) on December 22, 2021 (“Credit Agreement”). The Credit Agreement, which will expire on December 21, 2026, provides a committed revolving credit line of $50.0 million. The Credit Agreement requires the Company to comply with various covenants, including among other things, financial covenants to 1) maintain a leverage ratio of consolidated net debt to adjusted EBITDA, not to exceed 3.0 to 1; and 2) limit annual capital expenditures. The Credit Agreement allows the Company to, among other things, make distributions to shareholders, repurchase its stock, incur other debt or liens, or acquire or dispose of assets provided that the Company complies with certain requirements and limitations set forth in the Credit Agreement. The unused portion of the credit line is subject to a fee equal to 0.20% per annum multiplied by the amount of such unused portion.
Revolving Loans
Revolving loans under the Credit Agreement may be in the form of 1) a base rate loan that bears interest equal to (a) the greater of the Wall Street Journal prime rate and (b) the sum of (i) one-month reserve adjusted LIBOR and (ii) 2.50%, plus an applicable margin of 0.25% or 0.50%, subject to the Company’s total leverage ratio, or 2) a Eurodollar loan that bears interest equal to the sum of the reserved adjusted LIBOR rate for an interest period elected by the Company, plus an applicable margin of 1.25% or 1.50%, based upon the Company’s total leverage ratio. The Company may request loans up to the lower of a maximum exposure of $50.0 million or the amounts of unused credit under the Credit Agreement. The unused portion of the credit facility is subject to a facility fee in an amount equal to 0.20% per annum of the average unused portion of the revolving line. At the election of the lender following an event of default, the loans shall bear the aforementioned interest rate plus an additional 2%. As of December 31, 2021, there were no revolving loans outstanding under the Credit Agreement.
Letters of Credit
Under the Credit Agreement, the Company is allowed to request LCs up to the lower of a maximum exposure of $25.0 million or the amounts of unused credit under the Credit Agreement. The Credit Agreement does not require any cash collateral when LCs are issued; however, at the election of the lender following a default, the lender may require the Company to deposit cash in an amount equal to 103% of the LCs exposure. LCs are subject to customary fees and expenses for issuance or renewal, and all disbursements are subject to the same interest rate provision as noted directly above under Revolving Loans. LCs are limited to a term of one year, unless extended.
The following table presents the total outstanding LCs issued by the Company related to product warranty and performance guarantees.
| | | | | | | | | | | |
| December 31, |
| 2021 | | 2020 |
| (In thousands) |
| Outstanding letters of credit | $ | 13,960 | | | $ | 13,266 | |
| | | |
See Note 7, “Commitments and Contingencies – Guarantees,” for further discussion on product warranty and performance guarantees.
Loan and Pledge Agreement
The Company entered into a loan and pledge agreement with Citibank, N.A. on January 27, 2017, which was amended multiple times to accommodate the growth of the Company (the original loan and pledge agreement and its subsequent amendments are hereinafter referred to as the “Loan and Pledge Agreement”). The Loan and Pledge Agreement expired on December 22, 2021 when the Company entered into the Credit Agreement. The Loan and Pledge Agreement provided for a committed revolving credit line of $16.0 million and an uncommitted revolving credit line of $4.0 million. Under the Loan and Pledge Agreement, the Company was allowed to issue stand-by letters of credit (“SBLCs”) up to one year past the expiration date of the Loan and Pledge Agreement. On December 22, 2021, due to the termination of the Loan and Pledge Agreement, all outstanding SBLCs issued under the Loan and Pledge Agreement were covered as a Letter of Credit (“LCs”) issuance under the Credit Agreement.
Energy Recovery, Inc. | 2021 Form 10-K Annual Report | 68
ENERGY RECOVERY, INC.
NOTES TO CONSOLIDATED FINANCIAL STATEMENTS
Note 7 — Commitments and Contingencies
Operating Lease Obligations
The Company leases office, warehouse and manufacturing facilities under operating leases that expire on various dates through fiscal year 2030. The following table presents a summary of operating lease, right of use assets and lease liabilities.
| | | | | | | | | | | |
| December 31, |
| 2021 | | 2020 |
| (In thousands) |
| Operating lease, right of use asset | $ | 14,653 | | | $ | 16,090 | |
| | | |
| Lease liabilities, current | $ | 1,564 | | | $ | 1,243 | |
| Lease liabilities, non-current | 14,879 | | | 16,443 | |
| Total lease liability | $ | 16,443 | | | $ | 17,686 | |
The following tables present operating lease activities related to all leased properties.
| | | | | | | | | | | | | | | | | | | | | |
| | | Years Ended December 31, |
| | | | | 2021 | | 2020 | | 2019 |
| | | | | (In thousands) |
| Operating lease expense | | | | | $ | 2,571 | | | $ | 2,589 | | | $ | 1,894 | |
| Cash payments | | | | | 2,431 | | | 2,398 | | | 1,824 | |
| | | | | | | | | |
| | | | | | | | | | | | | | | | | |
| | | December 31 |
| | | | | 2021 | | 2020 | | |
| | | | | (In thousands) |
| | | | | | | | | |
| Non-cash lease liabilities arising from obtaining right-of-use assets | | | | | $ | — | | | $ | 6,384 | | | |
The following table presents other information related to outstanding operating leases as of December 31, 2021.
| | | | | | | | | |
| |
| | | | | |
| Weighted average remaining lease term | 7.4 years | | | | |
| Weighted average discount rate | 7.0% | | | | |
The following table presents the minimum lease payments by year under noncancelable operating leases, exclusive of execution costs.
| | | | | |
| | December 31,
2021 |
| (In thousands) |
| 2022 | $ | 2,650 | |
| 2023 | 2,580 | |
| 2024 | 2,812 | |
| 2025 | 2,736 | |
| 2026 | 2,982 | |
| 2027 and thereafter | 7,480 | |
| Total future minimum lease payments | 21,240 | |
| Less imputed lease interest | (4,797) | |
| Total lease liabilities | $ | 16,443 | |
Energy Recovery, Inc. | 2021 Form 10-K Annual Report | 69
ENERGY RECOVERY, INC.
NOTES TO CONSOLIDATED FINANCIAL STATEMENTS
Warranty
The following table presents the changes in the Company’s accrued product warranty reserve.
| | | | | | | | | | | | | | | | | | | | | |
| | | Years Ended December 31, |
| | | | | 2021 | | 2020 | | 2019 |
| | | | | (In thousands) |
| Warranty reserve balance, beginning of year | | | | | $ | 760 | | | $ | 631 | | | $ | 478 | |
| Warranty costs charged to cost of revenue | | | | | 445 | | | 403 | | | 402 | |
| Utilization charges against reserve | | | | | (16) | | | (36) | | | (56) | |
| Release of accrual related to expired warranties | | | | | (310) | | | (238) | | | (193) | |
| Warranty reserve balance, end of year | | | | | $ | 879 | | | $ | 760 | | | $ | 631 | |
Purchase Obligations
The Company has purchase order arrangements with its vendors for which the Company has not received the related goods or services as of December 31, 2021. These arrangements are subject to change based on the Company’s sales demand forecasts. The Company has the right to cancel the arrangements prior to the date of delivery. The purchase order arrangements are related to various raw materials and component parts, as well as capital equipment. As of December 31, 2021, the Company had approximately $10.3 million of such open cancellable purchase order arrangements.
Guarantees
The Company enters into indemnification provisions under its agreements with other companies in the ordinary course of business, typically with its customers. Under these provisions, the Company generally indemnifies and holds harmless the indemnified party for losses suffered or incurred by the indemnified party as a result of the Company’s activities, generally limited to personal injury and property damage caused by the Company’s employees at a customer’s plant, and in proportion to the employee’s percentage of fault for the accident. Damages incurred for these indemnifications would be covered by the Company’s general liability insurance to the extent provided by the policy limitations. The Company has not incurred material costs to defend lawsuits or settle claims related to these indemnification agreements. As a result, the estimated valuation of the potential liability arising from these agreements is not material. Accordingly, the Company recorded no liabilities for these agreements as of December 31, 2021 and 2020.
In certain cases, the Company issues product warranty and performance guarantees to its customers for amounts generally equal to 10% or less of the total sales agreement to endorse the execution of product delivery and to the warranty of design work, fabrication and operating performance of our devices. These guarantees are generally LCs that have a weighted average life at inception of 30 months. See Note 6, “Lines of Credit – Letters of Credit,” for information related to LCs.
Litigation
The Company is named in and subject to various proceedings and claims in connection with its business. The outcome of matters the Company has been, and currently is, involved in cannot be determined at this time, and the results cannot be predicted with certainty. There can be no assurance that these matters will not have a material effect on the Company’s results of operations in any future period, and a significant judgment could have a material impact on the Company’s financial condition, results of operations and cash flows. The Company may in the future become involved in additional litigation in the ordinary course of business, including litigation that could be material to its business.
The Company considers all claims on a quarterly basis and, based on known facts, assesses whether potential losses are considered reasonably possible, probable and estimable. Based upon this assessment, the Company then evaluates disclosure requirements and whether to accrue for such claims in its consolidated financial statements. The Company records a provision for a liability when it is both probable that a liability has been incurred and the amount of the loss can be reasonably estimated. These provisions are reviewed at least quarterly and are adjusted to reflect the impacts of negotiations, settlements, rulings, advice of legal counsel and other information and events pertaining to a particular case. As of December 31, 2021, the Company was not involved in any lawsuits, therefore there were no material losses which were probable or reasonably possible.
Energy Recovery, Inc. | 2021 Form 10-K Annual Report | 70
ENERGY RECOVERY, INC.
NOTES TO CONSOLIDATED FINANCIAL STATEMENTS
Note 8 — Income Taxes
The following table presents the Company’s U.S. and foreign components of consolidated income before income taxes and the provision for (benefit from) income taxes.
| | | | | | | | | | | | | | | | | |
| | Years Ended December 31, |
| | 2021 | | 2020 | | 2019 |
| (In thousands) |
| Income before income taxes: | | | | | |
| U.S. | $ | 13,913 | | | $ | 32,046 | | | $ | 12,180 | |
| Foreign | 91 | | | 87 | | | 76 | |
| Total income before income taxes | $ | 14,004 | | | $ | 32,133 | | | $ | 12,256 | |
| | | | | |
| Current tax provision (benefit): | | | | | |
| Federal | $ | — | | | $ | (148) | | | $ | (120) | |
| State | 10 | | | 5 | | | 3 | |
| Foreign | 80 | | | 40 | | | 66 | |
| Current tax provision (benefit) | 90 | | | (103) | | | (51) | |
| | | | | |
| Deferred tax provision (benefit): | | | | | |
| Federal | (382) | | | 5,547 | | | 949 | |
| State | 27 | | | 302 | | | 445 | |
| | | | | |
| Total deferred tax provision (benefit) | (355) | | | 5,849 | | | 1,394 | |
| Total provision for (benefit from) income taxes | $ | (265) | | | $ | 5,746 | | | $ | 1,343 | |
The Company has evaluated the impact of the global intangible low taxed income (“GILTI”) and has concluded that the impact to the Company is immaterial.
The following table presents a reconciliation of income taxes computed at the statutory federal income tax rate to the effective tax rate implied by the accompanying Consolidated Statements of Operations.
| | | | | | | | | | | | | | | | | |
| | Years Ended December 31, |
| | 2021 | | 2020 | | 2019 |
| U.S. federal taxes at statutory rate | 21 | % | | 21 | % | | 21 | % |
| State income tax, net of federal benefit | — | | | 1 | | | 4 | |
| | | | | |
| | | | | |
| Foreign rate differential | 1 | | | — | | | — | |
| | | | | |
| Stock-based compensation | (18) | | | (2) | | | (1) | |
| Non-deductible expenses | 1 | | | 1 | | | 2 | |
| Federal research credits | (7) | | | (3) | | | (16) | |
| | | | | |
| Other | — | | | — | | | 1 | |
| Effective tax rate | (2 | %) | | 18 | % | | 11 | % |
| | | | | |
| | | | | |
Energy Recovery, Inc. | 2021 Form 10-K Annual Report | 71
ENERGY RECOVERY, INC.
NOTES TO CONSOLIDATED FINANCIAL STATEMENTS
The following table presents the components of the Company’s net deferred tax asset, which is presented in other assets, non-current on the Consolidated Balance Sheets.
| | | | | | | | | | | |
| December 31, |
| | 2021 | | 2020 |
| (In thousands) |
| Deferred tax assets: | | | |
| Net operating loss carry forwards | $ | 4,119 | | | $ | 6,285 | |
| Accruals and reserves | 4,054 | | | 3,852 | |
| Operating lease liabilities | 3,581 | | | 3,848 | |
| Research and development, and foreign tax credit carry forwards | 10,393 | | | 8,851 | |
| Acquired intangibles | 483 | | | 641 | |
| Charitable contributions | 53 | | | 45 | |
| Total deferred tax assets | 22,683 | | | 23,522 | |
| Valuation allowance | (3,644) | | | (4,403) | |
| Total deferred tax assets, net of valuation allowance | 19,039 | | | 19,119 | |
| | | |
| Deferred tax liabilities: | | | |
| Depreciation on property and equipment | (2,644) | | | (2,985) | |
| Right of use asset | (3,184) | | | (3,489) | |
| Unrecognized gain on translation of foreign currency | (20) | | | (54) | |
| Goodwill | (1,770) | | | (1,561) | |
| Total deferred tax liabilities | (7,618) | | | (8,089) | |
| Net deferred tax asset | $ | 11,421 | | | $ | 11,030 | |
| | | |
| | | |
| | | |
| | | |
| | | |
| | | |
| | | |
| | | |
In asserting the recoverability of deferred tax assets, the Company considers whether it is more likely than not that the assets will be realized. The ultimate realization of deferred tax assets is dependent upon the generation of future taxable income during the periods in which those temporary differences become deductible.
The Company assesses the available positive and negative evidence to estimate if sufficient future taxable income will be generated to use the existing deferred tax assets. In making such a determination, the Company considers all available positive and negative evidence, including recent results of operations, scheduled reversals of deferred tax liabilities, projected future income, and available tax planning strategies. The Company reported a full valuation on its Ireland net operating losses due to a history of cumulative losses. In 2021, the Company dissolved the entity in Ireland, as a result, all Ireland net operating loss carryovers and related valuation allowance were eliminated.
On the basis of this evaluation, as of December 31, 2021, the Company recognized all of its U.S. federal and state deferred tax assets with the exception that the Company continues to maintain a valuation allowance on its California research and development (“R&D”) credit carryovers of $3.6 million. The Company will maintain a valuation allowance on its California R&D credit carryovers because it is more likely than not that the Company will continue to annually generate more California R&D tax credits than it utilizes, resulting in no net reduction of credits. The Company’s policy with respect to California R&D credits is that they are utilized on a last-in, first-out basis.
The Company continues to assert that the accumulated foreign earnings of its subsidiaries in Spain and Canada are permanently reinvested. Due to the U.S. Tax Cuts and Jobs Act (“Tax Act”) enacted in 2017, any future repatriation of the earnings of its subsidiaries in Spain and Canada would not be subject to U.S. federal income tax. The Company has estimated that the foreign withholding taxes and U.S. state income taxes related to a potential future repatriation of these earnings would be immaterial.
Energy Recovery, Inc. | 2021 Form 10-K Annual Report | 72
ENERGY RECOVERY, INC.
NOTES TO CONSOLIDATED FINANCIAL STATEMENTS
The following table presents the Company’s net operating loss carryforwards by taxing authority.
| | | | | | | | | | | | | | | | | |
| Expiration Year | | December 31, |
| | | 2021 | | 2020 |
| | | (In thousands) |
| Federal | 2034 | | $ | 15,864 | | | $ | 19,913 | |
| California | 2031 | | 10,744 | | | 11,043 | |
| Ireland | No Expiration Date | | — | | | 10,376 | |
| Total net operating loss carryforwards | | | $ | 26,608 | | | $ | 41,332 | |
Utilization of the net operating loss carryforward may be subject to a substantial annual limitation due to the ownership change limitations provided by the U.S. Internal Revenue Code (the “IRC”) and similar California provisions. The annual limitation will result in the expiration of the net operating loss carryforwards before utilization. The Company has estimated the amount which may ultimately be realized and recorded deferred tax assets accordingly. Due to the dissolution of the Ireland subsidiary in 2021, all Ireland net operating losses were eliminated in 2021.
The following table presents the Company’s R&D credit by taxing authority, minimum tax credit and foreign tax credit carryforwards.
| | | | | | | | | | | | | | | | | |
| Expiration Year | | December 31, |
| | 2021 | | 2020 |
| | | (In thousands) |
| Federal | 2030 | | $ | 6,737 | | | $ | 5,733 | |
| California | No Expiration Date | | 4,628 | | | 3,947 | |
| | | | | |
| Total credit carryforwards | | | $ | 11,365 | | | $ | 9,680 | |
Utilization of the credit carryforwards may be subject to a substantial annual limitation due to the ownership change limitations provided by the IRC and similar California provisions.
Accounting for uncertain tax positions is based on judgment regarding the largest amount that is greater than 50% likely of being realized upon the ultimate settlement with a taxing authority. The following table presents the aggregate changes in the balance of the gross unrecognized tax benefits.
| | | | | | | | | | | | | | | | | |
| Years Ended December 31, |
| | 2021 | | 2020 | | 2019 |
| (In thousands) |
| Gross unrecognized tax benefits, beginning of year | $ | 1,134 | | | $ | 963 | | | $ | 1,162 | |
| Additions: | | | | | |
| Prior year tax position | — | | | 9 | | | 27 | |
| Current year tax position | 193 | | | 167 | | | 163 | |
| Reductions: | | | | | |
| | | | | |
| Prior year tax position | (6) | | | (5) | | | (389) | |
| | | | | |
| Gross unrecognized tax benefits, end of year | $ | 1,321 | | | $ | 1,134 | | | $ | 963 | |
As of December 31, 2021, the Company had unrecognized tax benefits of $1.3 million, of which $0.8 million, if recognized, would affect the Company’s effective tax rate.
The Company adopted the accounting policy that interest and penalties are classified as part of its income taxes. As of December 31, 2021, there were no accrued interest or penalties associated with any unrecognized tax benefits.
There are currently no examinations by Federal, California, and foreign tax authorities. The Company believes that, as of December 31, 2021, the gross unrecognized tax benefits will not materially change in the next twelve months. The Company believes that it has adequately provided for any reasonably foreseeable outcomes related to any tax audits and that any settlement will not have a material adverse effect on the consolidated financial position or results of operations. However, there can be no assurances as to the possible outcomes.
Energy Recovery, Inc. | 2021 Form 10-K Annual Report | 73
ENERGY RECOVERY, INC.
NOTES TO CONSOLIDATED FINANCIAL STATEMENTS
Note 9 — Stockholders’ Equity
Preferred Stock
The Company has the authority to issue 10,000,000 shares of preferred stock with a par value of $0.001 per share. The Board of Directors has the authority, without action by the Company’s stockholders, to designate and issue shares of preferred stock in one or more series. The Board of Directors is also authorized to designate the rights, preferences, and voting powers of each series of preferred stock, any or all of which may be greater than the rights of the common stock including restrictions of dividends on the common stock, dilution of the voting power of the common stock, reduction of the liquidation rights of the common stock, and delaying or preventing a change in control of the Company without further action by the Company’s stockholders. To date, the Board of Directors has not designated any rights, preferences, or powers of any preferred stock, and as of December 31, 2021 and 2020, no shares of preferred stock were issued or outstanding.
Common Stock
The Company has the authority to issue 200,000,000 shares of common stock with a par value of $0.001 per share. Subject to the preferred rights of the holders of shares of any class or series of preferred stock as provided by the Board of Directors with respect to any such class or series of preferred stock, the holders of the common stock shall be entitled to receive dividends, as and when declared by the Board of Directors. In the event of any liquidation, dissolution, or winding up of the Company, whether voluntary or involuntary, after the distribution or payment to the holders of shares of any class or series of preferred stock as provided by the Board of Directors with respect to any such class or series of preferred stock, the remaining assets of the Company available for distribution to stockholders shall be distributed among and paid to the holders of common stock ratably in proportion to the number of shares of common stock held by them.
Share Repurchase Program
On March 9, 2021, the Company’s Board of Directors authorized a share repurchase program under which the Company may repurchase, at the discretion of management, up to $50.0 million in aggregate cost of the Company’s outstanding common stock (the “March 2021 Authorization”). Under the March 2021 Authorization, purchases of shares of common stock may be made from time to time in the open market, or in privately negotiated transactions, in compliance with applicable state and federal securities laws. The timing and amounts of any purchases will be based on market conditions and other factors including price, regulatory requirements, and capital availability. The March 2021 Authorization does not obligate the Company to acquire any specific number of shares in any period, and may be expanded, extended, modified or discontinued at any time without prior notice. The Company accounts for stock repurchases using the cost method. The aggregate cost includes fees and expenses charged in connection with acquiring the shares.
The following table presents the share repurchase activities and remaining program balance under the March 2021 Authorization as of December 31, 2021.
| | | | | | | | | | | | | | | | | | | | | | | |
| | Number of Shares Purchased | | Average Price Paid per Share(1) | | | Plan Activity |
| | | | | | | (In thousands) |
| March 2021 Authorization | | | | | | | $ | 50,000 | |
| Repurchases under March 2021 Authorization | | 1,265,218 | | $18.43 | | | (23,346) | |
| Remaining amount under March 2021 Authorization | | | | | | | $ | 26,654 | |
(1) Excluding commissions
Energy Recovery, Inc. | 2021 Form 10-K Annual Report | 74
ENERGY RECOVERY, INC.
NOTES TO CONSOLIDATED FINANCIAL STATEMENTS
Note 10 — Stock-based Compensation
Stock Option Plans
In July 2020, the stockholders approved the 2020 Incentive Plan (the “2020 Plan”), that permits the grant of stock options, stock appreciation rights, restricted stock, restricted stock awards (“RSA”), RSUs, performance units, performance shares, and other stock-based awards to employees, officers, directors, and consultants. Prior to the approval of the 2020 Plan, the Company maintained the 2016 Incentive Plan, and the Amended and Restated 2008 Equity Incentive Plan (hereinafter referred to as the “Predecessor Plans”). Subject to adjustments, as provided in the 2020 Plan, the number of shares of common stock initially authorized for issuance under the 2020 Plan was 5,894,727 shares (which consist of 4,500,000 new share awards plus 1,394,727 share awards that were authorized and unissued under the Predecessor Plans) plus up to 4,850,630 shares that were set aside for awards granted under the Predecessor Plans that are subsequently forfeited. The 2020 Plan supersedes all previously issued stock incentive plans (including the Predecessor Plans) and is currently the only available plan from which awards may be granted. The Company’s 2020 Plan and Predecessor Plans are hereinafter referred to as “Equity Incentive Plans.”
Shares available for grant under the 2020 Plan at December 31, 2021 were 5,208,569 shares. There were no shares available for grant under the Predecessor Plans after July 15, 2020.
Stock Options
Stock options outstanding at December 31, 2021 and to be granted subsequently after December 31, 2021, generally vest over four years and expire no more than 10 years after the date of grant. Non-employee board of director grants generally vest one year after the date of grant or on the date of the annual stockholders’ meeting following the date of grant, whichever comes first, and expire no more than 10 years after the date of grant.
Restricted Stock Awards
There were no RSAs outstanding as of December 31, 2021.
Restricted Stock Units
RSUs outstanding at, and to be awarded subsequently after, December 31, 2021, generally vest 25% annually over the four years from date of grant and are dependent upon continued employment. Non-employee board of director grants generally vest one year after the date of grant or on the date of the annual stockholders’ meeting following the date of grant, whichever comes first. As RSUs vest, the units will be settled in shares of common stock based on a one-to-one ratio. The units are valued based on the market price on the date of grant.
Energy Recovery, Inc. | 2021 Form 10-K Annual Report | 75
ENERGY RECOVERY, INC.
NOTES TO CONSOLIDATED FINANCIAL STATEMENTS
Fair Value Assumptions
Stock Options
The fair value of stock options granted to employees is based on the Black-Scholes option pricing model. To determine the inputs for the Black-Scholes option pricing model, the Company is required to develop several assumptions, which are highly subjective. The Company determines these assumptions as follows:
•Expected Term: The Company uses its historical data to determine the expected term of options based on historical exercise data. As there was no historical exercise data for non-employee directors, the Company determines the expected term based on the simplified method.
•Expected Volatility: The Company determines expected volatility based on its historical data and the corresponding expected term that was determined using the Company’s historical exercise data.
•Risk-Free Interest Rate: The risk-free rate is based on U.S. Treasury issues with remaining terms similar to the expected term on the stock options granted.
•Dividend Yield: The Company has never declared or paid any cash dividends and does not plan to pay cash dividends in the foreseeable future; therefore, the Company uses an expected dividend yield of zero in the valuation model.
The following table presents assumptions used in the Black-Scholes option pricing model to determine the estimated grant date fair values of stock options granted to employees.
| | | | | | | | | | | | | | | | | | | | | |
| | | | Years Ended December 31, |
| | | | | | 2021 | | 2020 | | 2019 |
| Weighted average expected life (years) | | | | | 4.0 | | 5.1 | | 4.6 |
| Weighted average expected volatility | | | | | 49.3% | | 71.7% | | 75.9% |
| Risk-free interest rate | | | | | 0.30% – 1.51% | | 0.29% – 1.32% | | 1.55% – 2.57% |
| Weighted average dividend yield | | | | | —% | | —% | | —% |
Restricted Stock Units
The fair value of RSUs granted to employees is based on the Company’s common stock price on the date of grant.
Energy Recovery, Inc. | 2021 Form 10-K Annual Report | 76
ENERGY RECOVERY, INC.
NOTES TO CONSOLIDATED FINANCIAL STATEMENTS
Stock-based Compensation Expense
The following table presents the stock-based compensation expense related to the fair value measurement of awards granted to employees by expense category and by type of award. All stock-based payment awards are amortized on a straight-line basis over the requisite service periods of the awards, generally the vesting periods.
| | | | | | | | | | | | | | | | | | | | | |
| | | | Years Ended December 31, |
| | | | | | 2021 | | 2020 | | 2019 |
| | | | | (In thousands) |
| Stock-based compensation expense charged to: | | | | | | | | | |
| Product cost of revenue | | | | | $ | 414 | | | $ | 135 | | | $ | 130 | |
| General and administrative | | | | | 2,917 | | | 2,615 | | | 3,090 | |
| Sales and marketing | | | | | 1,483 | | | 893 | | | 836 | |
| Research and development | | | | | 1,242 | | | 1,151 | | | 1,625 | |
| Total stock-based compensation expense | | | | | $ | 6,056 | | | $ | 4,794 | | | $ | 5,681 | |
| | | | | | | | | |
| Stock-based compensation expense by type of award: | | | | | | | | | |
| Stock options | | | | | $ | 3,161 | | | $ | 3,004 | | | $ | 3,940 | |
| RSUs | | | | | 2,895 | | | 1,790 | | | 1,741 | |
| Total stock-based compensation expense | | | | | $ | 6,056 | | | $ | 4,794 | | | $ | 5,681 | |
| | | | | | | | | |
Modifications of Equity Awards
During the year ended December 31, 2019, the Company recorded additional stock-based compensation expense of $0.6 million related to (1) the modification of certain equity awards resulting from the Company’s former Chairman of the Board’s retirement from service, on June 13, 2019, in consideration for his entering into a Settlement Agreement and Release, and (2) the Company’s former President and Chief Executive Officer’s resignation, on November 1, 2019, in consideration for his entering into a Settlement Agreement and Release.
Forfeitures
The Company estimates forfeitures at the time of grant and revises those estimates periodically in subsequent periods if actual forfeitures differ from those estimates. The Company uses historical data to estimate pre-vesting option forfeitures and records stock-based compensation expense only for those awards that are expected to vest. If the Company’s actual forfeiture rate is materially different from its estimate, the stock-based compensation expense could be significantly different from what the Company has recorded in the current period.
The following table presents the estimated weighted average forfeiture rates used in determining the expense in the stock-based compensation expense table above.
| | | | | | | | | | | | | | | | | | | | | |
| | | | Years Ended December 31, |
| | | | | | 2021 | | 2020 | | 2019 |
| Stock options and RSUs vested over 4-years | | | | | 8.1% | | 11.2% | | 11.6% |
| | | | | | | | | |
Unamortized Stock-Based Compensation Costs
Stock-based compensation costs related to unvested stock options and RSUs will generally be amortized on a straight-line basis over the remaining average service period of each award. The following table presents the unamortized compensation costs and weighted average service period of all unvested outstanding awards as of December 31, 2021.
| | | | | | | | | | | |
| Unamortized Compensation Costs | | Weighted Average Service Period |
| (In thousands) | | (In years) |
| Stock options | $ | 7,488 | | | 1.7 |
| RSUs | 6,422 | | | 2.6 |
| Total unamortized compensation costs, net of adjusted forfeitures | $ | 13,910 | | | |
Energy Recovery, Inc. | 2021 Form 10-K Annual Report | 77
ENERGY RECOVERY, INC.
NOTES TO CONSOLIDATED FINANCIAL STATEMENTS
Stock Option Activities
The following table presents stock option activities under the Equity Incentive Plans.
| | | | | | | | | | | | | | | | | | | | | | | |
| | Number of Shares | | Weighted Average Exercise Price | | Weighted Average Remaining Contractual Life | | Aggregate Intrinsic Value(1) |
| (In thousands) | | (Per share) | | (In years) | | (In thousands) |
| Balance, December 31, 2018 | 4,982 | | | $ | 6.36 | | | | | |
| Granted | 568 | | | 8.31 | | | | | |
| Exercised | (1,133) | | | 5.36 | | | | | $ | 4,781 | |
| Forfeited | (490) | | | 8.49 | | | | | |
| Balance, December 31, 2019 | 3,927 | | | 6.66 | | | | | |
| Granted | 806 | | | 8.78 | | | | | |
| Exercised | (926) | | | 4.79 | | | | | 4,637 | |
| Forfeited | (187) | | | 9.15 | | | | | |
| Balance, December 31, 2020 | 3,620 | | | 7.48 | | | | | |
| Granted | 613 | | | 14.39 | | | | | |
| Exercised | (1,518) | | | 6.96 | | | | | 16,952 | |
| Forfeited | (171) | | | 11.26 | | | | | |
| Balance, December 31, 2021 | 2,544 | | | $ | 9.21 | | | 6.8 | | $ | 31,243 | |
| Vested and exercisable as of December 31, 2021 | 1,555 | | | $ | 7.61 | | | 5.7 | | $ | 21,573 | |
| Vested and exercisable as of December 31, 2021 and expected to vest thereafter | 2,444 | | | $ | 9.09 | | | 6.8 | | $ | 30,305 | |
(1) The aggregate intrinsic value of an exercised option is calculated as the difference between the exercise price of the underlying option and the fair value of the Company’s common stock at the time of exercise. The aggregate intrinsic value at December 31, 2021 is calculated as the difference between the exercise price of the underlying outstanding options and the fair value of the Company’s common stock as of December 31, 2021 or the last trading day prior to December 31, 2021.
Restricted Stock Unit Activities
The following table presents RSU activities under the Equity Incentive Plans.
| | | | | | | | | | | |
| | Number of Shares | | Weighted Average Grant Date Fair Value |
| (In thousands) | | (Per share) |
| Balance, December 31, 2018 | 463 | | | $ | 8.49 | |
| Awarded | 415 | | | 7.80 | |
| Vested | (201) | | | 8.62 | |
| Forfeited | (133) | | | 8.37 | |
| Balance, December 31, 2019 | 544 | | | 7.95 | |
| Awarded | 368 | | | 10.33 | |
| Vested | (161) | | | 8.12 | |
| Forfeited | (64) | | | 8.86 | |
| Balance, December 31, 2020 | 687 | | | 9.10 | |
| Awarded | 387 | | | 15.44 | |
| Vested | (230) | | | 8.98 | |
| Forfeited | (150) | | | 11.14 | |
| Balance, December 31, 2021 | 694 | | | 12.23 | |
Energy Recovery, Inc. | 2021 Form 10-K Annual Report | 78
ENERGY RECOVERY, INC.
NOTES TO CONSOLIDATED FINANCIAL STATEMENTS
Vested Stock Options and RSUs
The following table presents the total grant date fair value of stock options and RSUs vested during the period.
| | | | | | | | | | | | | | | | | | | | | |
| | | Years Ended December 31, |
| | | | | 2021 | | 2020 | | 2019 |
| | | | | (In thousands) |
| Stock options | | | | | $ | 3,298 | | | $ | 2,915 | | | $ | 4,025 | |
| RSUs | | | | | 2,060 | | | 1,310 | | | 1,733 | |
| Total grant date fair value of stock options and RSUs vested during the period | | | | | $ | 5,358 | | | $ | 4,225 | | | $ | 5,758 | |
Energy Recovery, Inc. | 2021 Form 10-K Annual Report | 79
ENERGY RECOVERY, INC.
NOTES TO CONSOLIDATED FINANCIAL STATEMENTS
Note 11 — Segment Reporting
The Company’s chief operating decision-maker (“CODM”) is its chief executive officer. The Company continues to monitor and review its segment reporting structure in accordance with authoritative guidance to determine whether any changes have occurred that would impact its reportable segments. As a result of the evolution of the Company’s products, operations and research and development efforts in new product development, and the way in which the CODM manages and assesses the performance of the business, starting in the first quarter of fiscal year 2021, the Company realigned its segment reporting and has recast the prior year amounts for comparability. In addition, to better align the activities of the segments, the Company has re-allocated certain corporate resources to the segments’ operations.
Income and type of expense activities that are included in the Water and Emerging Technologies segments and corporate operating expenses are as follows:
Water segment: The continued development, sales and support of the PX, Turbochargers and pumps used in seawater desalination and industrial wastewater activities.
Emerging Technologies segment: The continued development, sales and support of activities related to emerging technologies, such as the PX G1300 used in industrial and commercial refrigeration applications; the ISOBoost used in natural gas processing; the VorTeq used in the oil and gas markets; and certain other new products.
Corporate operating expenses: Corporate activities outside of the operating segments, such as audit and accounting expenses, general legal costs, board of director fees and expenses, and other separately managed general expenses not related to the identified segments.
Energy Recovery, Inc. | 2021 Form 10-K Annual Report | 80
ENERGY RECOVERY, INC.
NOTES TO CONSOLIDATED FINANCIAL STATEMENTS
Segment Financial Information
The following table presents a summary of the Company’s financial information by segment and corporate operating expenses. For each of the periods presented in the following table, operating income (loss) for each segment excludes other income and expenses, and corporate operating expenses not included in how the CODM assesses the performance of the operating segments, such as income taxes and other separately managed expenses not attributed to the operating segments. Assets and liabilities are reviewed at the consolidated level by the CODM and are not attributed to the segments. The CODM allocates resources to, and assesses the performance of, each operating segment using information about its revenue and operating income.
| | | | | | | | | | | | | | | | | | | | | | | | | | | | | | | | | | | | | | | | | | | | | | | | | | | | | |
| Year Ended December 31, 2021 | | Year Ended December 31, 2020 (Recast) | | Year Ended December 31, 2019 (Recast) |
| Water | | Emerging Technologies | | Total | | Water | | Emerging Technologies | | Total | | Water | | Emerging Technologies | | Total |
| (In thousands) |
| Product revenue | $ | 103,851 | | | $ | 53 | | | $ | 103,904 | | | $ | 92,061 | | | $ | 30 | | | $ | 92,091 | | | $ | 72,730 | | | $ | 104 | | | $ | 72,834 | |
| Product cost of revenue | 32,670 | | | — | | | 32,670 | | | 28,239 | | | 10 | | | 28,249 | | | 20,148 | | | 187 | | | 20,335 | |
| Product gross profit (loss) | 71,181 | | | 53 | | | 71,234 | | | 63,822 | | | 20 | | | 63,842 | | | 52,582 | | | (83) | | | 52,499 | |
| | | | | | | | | | | | | | | | | |
License and development revenue (1) | — | | | — | | | — | | | — | | | 26,895 | | | 26,895 | | | — | | | 14,108 | | | 14,108 | |
| | | | | | | | | | | | | | | | | |
| Operating expenses | | | | | | | | | | | | | | | | | |
| General and administrative | 6,330 | | | 5,162 | | | 11,492 | | | 9,172 | | | 5,410 | | | 14,582 | | | 6,879 | | | 4,955 | | | 11,834 | |
| Sales and marketing | 9,559 | | | 937 | | | 10,496 | | | 5,958 | | | 1,192 | | | 7,150 | | | 7,072 | | | 1,239 | | | 8,311 | |
| Research and development | 2,589 | | | 17,480 | | | 20,069 | | | 2,973 | | | 20,476 | | | 23,449 | | | 3,825 | | | 19,577 | | | 23,402 | |
| Amortization of intangible assets | 12 | | | — | | | 12 | | | 16 | | | — | | | 16 | | | 575 | | | — | | | 575 | |
| Impairment of long-lived assets | — | | | — | | | — | | | — | | | 2,332 | | | 2,332 | | | — | | | — | | | — | |
| Total operating expenses | 18,490 | | | 23,579 | | | 42,069 | | | 18,119 | | | 29,410 | | | 47,529 | | | 18,351 | | | 25,771 | | | 44,122 | |
| | | | | | | | | | | | | | | | | |
| Operating income (loss) | $ | 52,691 | | | $ | (23,526) | | | 29,165 | | | $ | 45,703 | | | $ | (2,495) | | | 43,208 | | | $ | 34,231 | | | $ | (11,746) | | | 22,485 | |
| | | | | | | | | | | | | | | | | |
| Less: Corporate operating expenses | | | | | 15,334 | | | | | | | 11,914 | | | | | | | 12,121 | |
| Income from operations | | | | | 13,831 | | | | | | | 31,294 | | | | | | | 10,364 | |
| Other income, net | | | | | 173 | | | | | | | 839 | | | | | | | 1,892 | |
| Income before income taxes | | | | | $ | 14,004 | | | | | | | $ | 32,133 | | | | | | | $ | 12,256 | |
| | | | | | | | | | | | | | | | | |
| | | | | | | | | | | | | | | | | |
(1) In June 2020, the Company and Schlumberger entered into an agreement to terminate the VorTeq License Agreement. The termination of the VorTeq License Agreement was effective June 1, 2020. As there were no future performance obligations to be recognized under the VorTeq License Agreement after the effective date, the Company recognized in full the remaining deferred revenue balance of $24.4 million in the second quarter of fiscal year 2020. In addition, no future license and development revenue was recognized under the VorTeq License Agreement after the second quarter of fiscal year 2020.
Energy Recovery, Inc. | 2021 Form 10-K Annual Report | 81
ENERGY RECOVERY, INC.
NOTES TO CONSOLIDATED FINANCIAL STATEMENTS
The following table presents a summary of the Company’s depreciation and amortization by segment and corporate operating expenses.
| | | | | | | | | | | | | | | | | | | | | |
| | | | Years Ended December 31, |
| | | | | 2021 | | 2020 | | 2019 |
| | | | | (In thousands) |
| Water | | | | | $ | 1,823 | | | $ | 1,354 | | | $ | 1,824 | |
| Emerging Technologies | | | | | 2,199 | | | 2,125 | | | 2,251 | |
| Corporate | | | | | 480 | | | 412 | | | 320 | |
| Total depreciation and amortization | | | | | $ | 4,502 | | | $ | 3,891 | | | $ | 4,395 | |
| | | | | | | | | |
Energy Recovery, Inc. | 2021 Form 10-K Annual Report | 82
ENERGY RECOVERY, INC.
NOTES TO CONSOLIDATED FINANCIAL STATEMENTS
Note 12 — Concentrations
Product Revenue by Geographic Location
The following table presents the Company’s product revenue by geographic locations. The geographic information includes product revenue from our domestic and international customers based on the customers’ requested delivery locations, except for certain cases in which the customer directed the Company to deliver its products to a location that differs from the known ultimate location of use. In such cases, the ultimate location of use rather than the delivery location is reflected in the table.
| | | | | | | | | | | | | | | | | | | | | |
| | | | Years Ended December 31, |
| | | | | | 2021 | | 2020 | | 2019 |
| | | | | |
| | | | | | | | | |
| | | | | | | | | |
| | | | | | | | | |
| | | | | | | | | |
| | | | | | | | | |
| Product revenue by geographic location: | | | | | | | | | |
| United States | | | | | 1% | | 2% | | 2% |
| International | | | | | 99% | | 98% | | 98% |
| Total product revenue | | | | | 100% | | 100% | | 100% |
| | | | | | | | | |
Product revenue by country:(1) | | | | | | | | | |
| Saudi Arabia | | | | | 36% | | 34% | | 29% |
| United Arab Emirates | | | | | 17% | | 18% | | 10% |
| Israel | | | | | 14% | | ** | | ** |
| Egypt | | | | | ** | | 10% | | ** |
| | | | | | | | | |
| | | | | | | | | |
| | | | | | | | | |
| | | | | | | | | |
| | | | | | | | | |
| | | | | | | | | |
| | | | | | | | | |
| | | | | | | | | |
Others(2) | | | | | 33% | | 38% | | 61% |
| Total | | | | | 100% | | 100% | | 100% |
| | | | | | | | | |
| | | | | | | | | |
| | | | | | | | | |
** Zero or less than 10%.
(1) Countries representing more than 10% of product revenues for the periods presented.
(2) Countries in the aggregate, individually representing less than 10% of product revenues for the periods presented.
Product Revenue
The following table presents customers accounting for 10% or more of product revenue by segment. Although certain customers might account for greater than 10% of product revenue at any one point in time, the concentration of product revenue between a limited number of customers shifts regularly, depending on timing of MPD shipments. The percentages by customer reflect specific relationships or contracts that would concentrate product revenue for the periods presented and does not indicate a trend specific to any one customer.
| | | | | | | | | | | | | | | | | | | | | | | | | | | | | | | |
| | | | | | | Years Ended December 31, |
| | | | Segment | | | | | | 2021 | | 2020 | | 2019 |
| Customer A | | | Water | | | | | | 21% | | 27% | | ** |
| Customer B | | | Water | | | | | | 16% | | ** | | ** |
| Customer C | | | Water | | | | | | 11% | | ** | | ** |
| Customer D | | | Water | | | | | | 10% | | 23% | | 19% |
| | | | | | | | | | | | | |
| | | | | | | | | | | | | |
| | | | | | | | | | | | | |
| | | | | | | | | | | | | |
| | | | | | | | | | | | | |
| | | | | | | | | | | | | |
| | | | | | | | | | | | | |
| | | | | | | | | | | | | |
| | | | | | | | | | | | | |
| | | | | | | | | | | | | |
| | | | | | | | | | | | | |
| | | | | | | | | | | | | |
| | | | | | | | | | | | | |
| | | | | | | | | | | | | |
** Zero or less than 10%.
License and Development Revenue
There was no Emerging Technologies segment customer license and development revenue for the year ended December 31, 2021. The Emerging Technologies segment had one international customer, Schlumberger, which accounted for 100% of the license and development revenue for the years ended December 31, 2020 and 2019. See Note 2, “Revenue,” for further discussion related to the termination of the VorTeq License Agreement.
Long-lived Assets
All of the Company’s long-lived assets were located in the United States at December 31, 2021 and 2020.
Energy Recovery, Inc. | 2021 Form 10-K Annual Report | 83
ENERGY RECOVERY, INC.
NOTES TO CONSOLIDATED FINANCIAL STATEMENTS
Major Supply Vendors
The following table presents the major supply vendors accounting for 10% or more of the Company’s consolidated supply and manufacturing costs purchases.
| | | | | | | | | | | | | | | | | | | | | | | | | | |
| | | | | | Years Ended December 31, | | |
| | | | | | | | 2021 | | 2020 | | | |
| Vendor A | | | | | | | | 24% | | 16% | | | | |
| Vendor B | | | | | | | | 16% | | 19% | | | | |
| Vendor C | | | | | | | | 12% | | ** | | | | |
| | | | | | | | | | | | | | |
| | | | | | | | | | | | | | |
| | | | | | | | | | | | | | |
| | | | | | | | | | | | | | |
| | | | | | | | | | | | | | |
| | | | | | | | | | | | | | |
| | | | | | | | | | | | | | |
| | | | | | | | | | | | | | |
| | | | | | | | | | | | | | |
| | | | | | | | | | | | | | |
| | | | | | | | | | | | | | |
** Zero or less than 10%.
Energy Recovery, Inc. | 2021 Form 10-K Annual Report | 84
Item 9 — Changes in and Disagreements with Accountants on Accounting and Financial Disclosure
None.
Item 9A — Controls and Procedures
Evaluation of Disclosure Controls and Procedures
Our management has evaluated, with the participation of our Chief Executive Officer and Chief Financial Officer, the effectiveness of our disclosure controls and procedures (as defined in Rules 13a-15(e) and 15d-15(e) under the Securities Exchange Act of 1934, or “Exchange Act”) as of the end of the period covered by this Annual Report on Form 10-K. Based on that evaluation, our Chief Executive Officer and Chief Financial Officer have concluded that, as of such date, our disclosure controls and procedures were effective to ensure that information we are required to disclose in reports that we file or submit under the Exchange Act is recorded, processed, summarized, and reported within the time periods specified in Securities and Exchange Commission rules and forms and that such information is accumulated and communicated to management as appropriate to allow for timely decisions regarding required disclosure.
Our disclosure controls and procedures are designed to provide reasonable assurance of achieving their objectives, and our Chief Executive Officer and Chief Financial Officer have concluded that these controls and procedures are effective at the “reasonable assurance” level. Our management, including the Chief Executive Officer and Chief Financial Officer, believes that a control system, no matter how well designed and operated, cannot provide absolute assurance that the objectives of the control system are met, and that no evaluation of controls can provide absolute assurance that all control issues and instances of fraud, if any, within a company have been detected.
Management’s Annual Report on Internal Control Over Financial Reporting and Attestation Report of the Registered Public Accounting Firm
Management’s Report on Internal Control Over Financial Reporting
Management is responsible for establishing and maintaining adequate internal control over the Company’s financial reporting. Management assessed the effectiveness of the Company’s internal control over financial reporting as of December 31, 2021. In making this assessment, management used the criteria set forth by the Committee of Sponsoring Organizations of the Treadway Commission (COSO) in Internal Control — Integrated Framework (2013). Based on the assessment using those criteria, management concluded that, as of December 31, 2021, our internal control over financial reporting was effective.
Attestation Report of the Registered Public Accounting Firm
The Company’s independent registered public accountants, Deloitte & Touche, LLP, audited the Consolidated Financial Statements included in this Annual Report on Form 10-K and have issued an audit report on the Company’s internal control over financial reporting. The report on the audit of internal control over financial reporting appears in Part II, Item 8, “Financial Statements and Supplementary Data,” in this Annual Report on Form 10-K.
Changes in Internal Control Over Financial Reporting
There were no changes in our internal control over financial reporting that occurred during our most recent fiscal quarter that have materially affected, or are reasonably likely to materially affect, our internal control over financial reporting despite the fact that a majority of our non-manufacturing employees were working remotely due to the COVID-19 pandemic.
Item 9B — Other Information
None.
Item 9C — Disclosure Regarding Foreign Jurisdictions that Prevent Inspections
Not applicable.
Energy Recovery, Inc. | 2021 Form 10-K Annual Report | 85
PART III
Certain information required by Part III is omitted from this report because we will file with the SEC a definitive proxy statement pursuant to Regulation 14A, or the 2022 Proxy Statement (“Proxy Statement”), no later than 120 days after the end of fiscal year 2021, and certain information included therein is incorporated herein by reference.
Item 10 — Directors, Executive Officers and Corporate Governance
The information required by this Item is included in and incorporated by reference from the Proxy Statement.
Item 11 — Executive Compensation
The information required by this Item is included in and incorporated by reference from the Proxy Statement under the captions “Director Compensation,” “Executive Compensation,” “Compensation Committee Interlocks and Insider Participation,” “Compensation Discussion and Analysis,” “Report of the Compensation Committee” and “Compensation Policies and Practices as They Relate to Risk Management.”
Item 12 — Security Ownership of Certain Beneficial Owners and Management and Related Stockholder Matters
The following table sets forth equity compensation plan information as of December 31, 2021.
| | | | | | | | | | | | | | | | | | | | |
| Plan Category | | Number of Securities to be Issued Upon Exercise of Outstanding Options, Warrants, and Rights | | Weighted- Average Exercise Price of Outstanding Options, Warrants, and Rights | | Number of Securities Remaining Available for Future Issuance Under Equity Compensation Plans (Excluding Securities Reflected in the First Column) |
Equity compensation plans approved by security holders (1) | | 3,238,278 | | $9.21 | | 5,208,569 |
| Equity compensation plans not approved by security holders | | None | | Not applicable | | Not applicable |
(1)Represents shares of our common stock issuable upon exercise of options outstanding under the following equity compensation plans: the 2020 Incentive Plan, the 2016 Incentive Plan, and the Amended and Restated 2008 Equity Incentive Plan.
The information required by this Item is included in and incorporated by reference from the Proxy Statement under the captions “Security Ownership of Certain Beneficial Owners and Management,” “Equity-Based Incentive Compensation” and “Additional Information Regarding Executive Compensation.”
Item 13 — Certain Relationships and Related Transactions and Director Independence
The information required by this Item is included in and incorporated by reference from the Proxy Statement under the captions “Related Person Policies and Transactions” and “Information About the Board of Directors and Corporate Governance Matters.”
Item 14 — Principal Accounting Fees and Services
The information required by this item is included in and incorporated by reference from the Proxy Statement under the caption “Principal Accountant Fees and Services.”
With the exception of the information specifically incorporated by reference in Part III to this Annual Report on Form 10-K from the Proxy Statement, the Proxy Statement shall not be deemed to be filed as part of this report.
Energy Recovery, Inc. | 2021 Form 10-K Annual Report | 86
PART IV
Item 15 — Exhibits and Financial Statement Schedules
Financial Statements
(a)The following documents are included as part of this Annual Report on Form 10-K:
(1)Financial Statements. The financial statements included in Part II, Item 8, “Financial Statements and Supplementary Data,” of this Annual Report on Form 10-K.
(2)Financial Statement Schedule. See Note 4, “Other Financial Information-Allowance for Doubtful Accounts,” of the Notes. Schedules not listed have been omitted because information required to be set forth therein is not applicable or is shown in the financial statements or notes thereto.
(b)Financial Statement Schedules. All financial statement schedules are omitted because they are not applicable, not required, or because the required information is included in the Consolidated Financial Statements, the Notes thereto, or in the Exhibits listed under Item 15(a)(2).
Energy Recovery, Inc. | 2021 Form 10-K Annual Report | 87
(c)Exhibits required by Item 601 of Regulation S-K.
| | | | | | | | | | | | | | | | | | | | | | | | | | | | | | | | | | | | | | |
| Exhibit Number | | Exhibit Description | | Incorporated by Reference | | Filed Herewith |
| Form | | File No. | | Exhibit | | Filing Date | |
| | | | 10-Q | | 001-34112 | | 3.1 | | 8/6/2021 | | |
| | | | 8-K | | 001-34112 | | 3.1 | | 4/16/2021 | | |
| | | | | | | | | | | | X |
| | | | S-1/A | | 333-150007 | | 10.1 | | 5/12/2008 | | |
| | | | DEF14A | | 001-34112 | | Appendix A | | 4/27/2012 | | |
| | | | 10-Q | | 001-34112 | | 10.43 | | 8/8/2011 | | |
| | | | 8-K | | 001-34112 | | 10.1 | | 3/9/2012 | | |
| | | | 8-K | | 001-34112 | | 10.1 | | 3/2/2016 | | |
| | | | DEF14A | | 001-34112 | | Appendix A | | 4/27/2016 | | |
| | | | 8-K | | 001-34112 | | 99.1 | | 6/22/2016 | | |
| | | | 8-K | | 001-34112 | | 10.1 | | 4/18/2018 | | |
| | | | 8-K | | 001-34112 | | 2.2 | | 8/15/2018 | | |
| | | | 8-K | | 001-34112 | | 10.3 | | 8/27/2018 | | |
| | | | 8-K | | 001-34112 | | 10.1 | | 1/16/2019 | | |
| | | | 10-Q | | 001-34112 | | 10.1 | | 5/1/2020 | | |
| | | | 8-K/A | | 001-34112 | | 10.1 | | 5/22/2020 | | |
| | | | DEF14A | | 001-34112 | | Appendix A | | 5/29/2020 | | |
| | | | 8-K | | 001-34112 | | 10.1 | | 2/10/2021 | | |
| | | | 8-K | | 001-34112 | | 10.1 | | 1/6/2022 | | |
| | | | 10-K | | 001-34112 | | 14.1 | | 3/27/2009 | | |
| | | | | | | | | | | | X |
| | | | | | | | | | | | X |
| | | | | | | | | | | | X |
| | | | | | | | | | | | X |
| | | | | | | | | | | | X |
| 101 | | Inline XBRL Document Set for the consolidated financial statements and accompanying notes in Part II, Item 8, “Financial Statements and Supplementary Data” of this Annual Report on Form 10-K. | | | | | | | | | | X |
| 104 | | Inline XBRL for the cover page of this Annual Report on Form 10-K, included in the Exhibit 101 Inline XBRL Document Set. | | | | | | | | | | X |
| | | | | | | | | | | | |
| | | | | | | | | | | | |
| | | | | | | | | | | | |
| | | | | | | | | | | | |
| | | | | | | | | | | | |
| | | | | | | | | | | | |
| | | | | | | | | | | | |
| | | | | | | | | | | | |
| | | | | | | | | | | | |
| | | | | | | | | | | | |
| | | | | | | | | | | | |
| | | | | | | | | | | | |
| | | | | | | | | | | | |
| | | | | | | | | | | | |
| | | | | | | | | | | | |
| | | | | | | | | | | | |
| | | | | | | | | | | | |
| | | | | | | | | | | | |
| | | | | | | | | | | | |
| | | | | | | | | | | | |
| | | | | | | | | | | | |
| | | | | | | | | | | | |
| | | | | | | | | | | | |
| | | | | | | | | | | | |
| | | | | | | | | | | | |
| | | | | | | | | | | | |
| | | | | | | | | | | | |
| | | | | | | | | | | | |
| | | | | | | | | | | | |
| | | | | | | | | | | | |
| | | | | | | | | | | | |
| | | | | | | | | | | | |
| | | | | | | | | | | | |
| | | | | | | | | | | | |
| | | | | | | | | | | | |
| | | | | | | | | | | | |
| | | | | | | | | | | | |
* Indicates management compensatory plan, contract or arrangement. ** The certifications furnished in Exhibits 32.1 are deemed to accompany this Form 10-K and are not deemed “filed” for purposes of Section 18 of the Exchange Act, or otherwise subject to the liability of that section, nor shall they be deemed incorporated by reference into any filing under the Securities Act or the Exchange Act.
Energy Recovery, Inc. | 2021 Form 10-K Annual Report | 88
Item 16 — Form 10-K Summary
None.
Energy Recovery, Inc. | 2021 Form 10-K Annual Report | 89
SIGNATURES
Pursuant to the requirements of Section 13 or 15(d) of the Securities Exchange Act of 1934, the Registrant has duly caused this Report to be signed on its behalf by the undersigned, thereunto duly authorized, as of the 24th day of February, 2022.
| | | | | | | | |
| | ENERGY RECOVERY, INC. | |
| | | |
| | /s/ ROBERT YU LANG MAO | |
| | Robert Yu Lang Mao | |
| President and Chief Executive Officer | |
Pursuant to the requirements of the Securities and Exchange Act of 1934, this Report has been signed below by the following persons on behalf of the Registrant and in the capacities and on the dates indicated.
| | | | | | | | | | | | | | |
| Signature | | Title | | Date |
| | | | | |
| /s/ ROBERT YU LANG MAO | | Chairman of the Board, Director, and President and Chief Executive Officer
(Principal Executive Officer) | | February 24, 2022 |
| Robert Yu Lang Mao | | | |
| | | | | |
| /s/ JOSHUA BALLARD | | Chief Financial Officer | | February 24, 2022 |
| Joshua Ballard | | (Principal Financial and Accounting Officer) | | |
| | | | | |
| /s/ ALEXANDER J. BUEHLER | | Director | | February 24, 2022 |
| Alexander J. Buehler | | | | |
| | | | | |
| /s/ JOAN K. CHOW | | Director | | February 24, 2022 |
| Joan K. Chow | | | | |
| | | | |
| /s/ OLAV FJELL | | Director | | February 24, 2022 |
| Olav Fjell | | | | |
| | | | | |
| /s/ SHERIF FODA | | Director | | February 24, 2022 |
| Sherif Foda | | | | |
| | | | | |
| /s/ ARVE HANSTVEIT | | Director | | February 24, 2022 |
| Arve Hanstveit | | | | |
| | | | | |
| | | | |
| | | | |
| | | | |
| /s/ LISA POLLINA | | Director | | February 24, 2022 |
| Lisa Pollina | | | | |
| | | | |
| /s/ PAMELA TONDREAU | | Director | | February 24, 2022 |
| Pamela Tondreau | | | | |
| | | | |
| | | | |
| | | | |
| | | | |
Energy Recovery, Inc. | 2021 Form 10-K Annual Report | 90