Exhibit 99.1 Driving Industrial Sustainability Delivering Value in Fluid-Flow Processes November 24, 2020 Joshua Ballard, Chief Financial Officer, Energy Recovery NASDAQ: ERII
FORWARD LOOKING STATEMENT This presentation contains forward-looking statements within the “Safe Harbor” provisions of the Private Securities Litigation Reform Act of 1995. Forward-looking statements in this report include, but are not limited to, statements about our expectations, objectives, anticipations, plans, hopes, beliefs, intentions, or strategies regarding the future. Forward-looking statements that represent our current expectations about future events are based on assumptions and involve risks and uncertainties. If the risks or uncertainties occur or the assumptions prove incorrect, then our results may differ materially from those set forth or implied by the forward-looking statements. Our forward-looking statements are not guarantees of future performance or events. Words such as “expects,” “anticipates,” “believes,” “estimates,” variations of such words, and similar expressions are also intended to identify such forward-looking statements. These forward-looking statements are subject to risks, uncertainties, and assumptions that are difficult to predict; therefore, actual results may differ materially and adversely from those expressed in any forward-looking statements. You should not place undue reliance on these forward-looking statements, which reflect management’s opinions only as of the date of this presentation. All forward-looking statements included in this presentation are subject to certain risks and uncertainties, which could cause actual results to differ materially from those projected in the forward-looking statements, as disclosed from time to time in our reports on Forms 10-K, 10-Q, and 8-K as well as in our Annual Reports to Stockholders and, if necessary, updated in our quarterly reports on Form 10 Q or in other filings. We assume no obligation to update any such forward-looking statements. It is important to note that our actual results could differ materially from the results set forth or implied by our forward-looking statements. Confidential & Proprietary 2
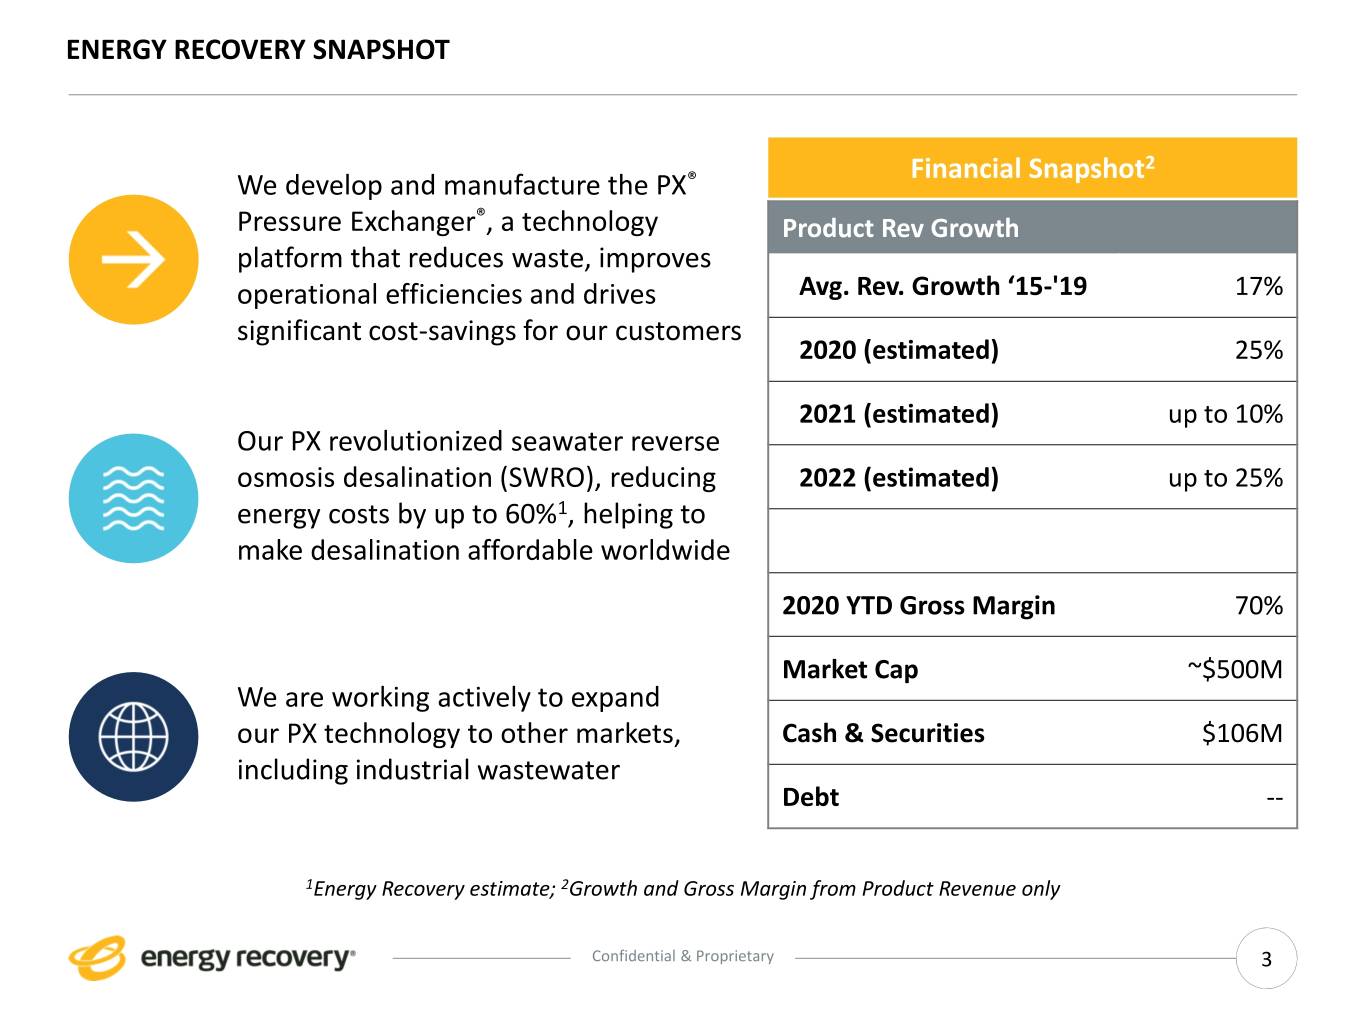
ENERGY RECOVERY SNAPSHOT Financial Snapshot2 We develop and manufacture the PX® Pressure Exchanger®, a technology Product Rev Growth platform that reduces waste, improves operational efficiencies and drives Avg. Rev. Growth ‘15-'19 17% significant cost-savings for our customers 2020 (estimated) 25% 2021 (estimated) up to 10% Our PX revolutionized seawater reverse osmosis desalination (SWRO), reducing 2022 (estimated) up to 25% energy costs by up to 60%1, helping to make desalination affordable worldwide 2020 YTD Gross Margin 70% Market Cap ~$500M We are working actively to expand our PX technology to other markets, Cash & Securities $106M including industrial wastewater Debt -- 1Energy Recovery estimate; 2Growth and Gross Margin from Product Revenue only Confidential & Proprietary 3
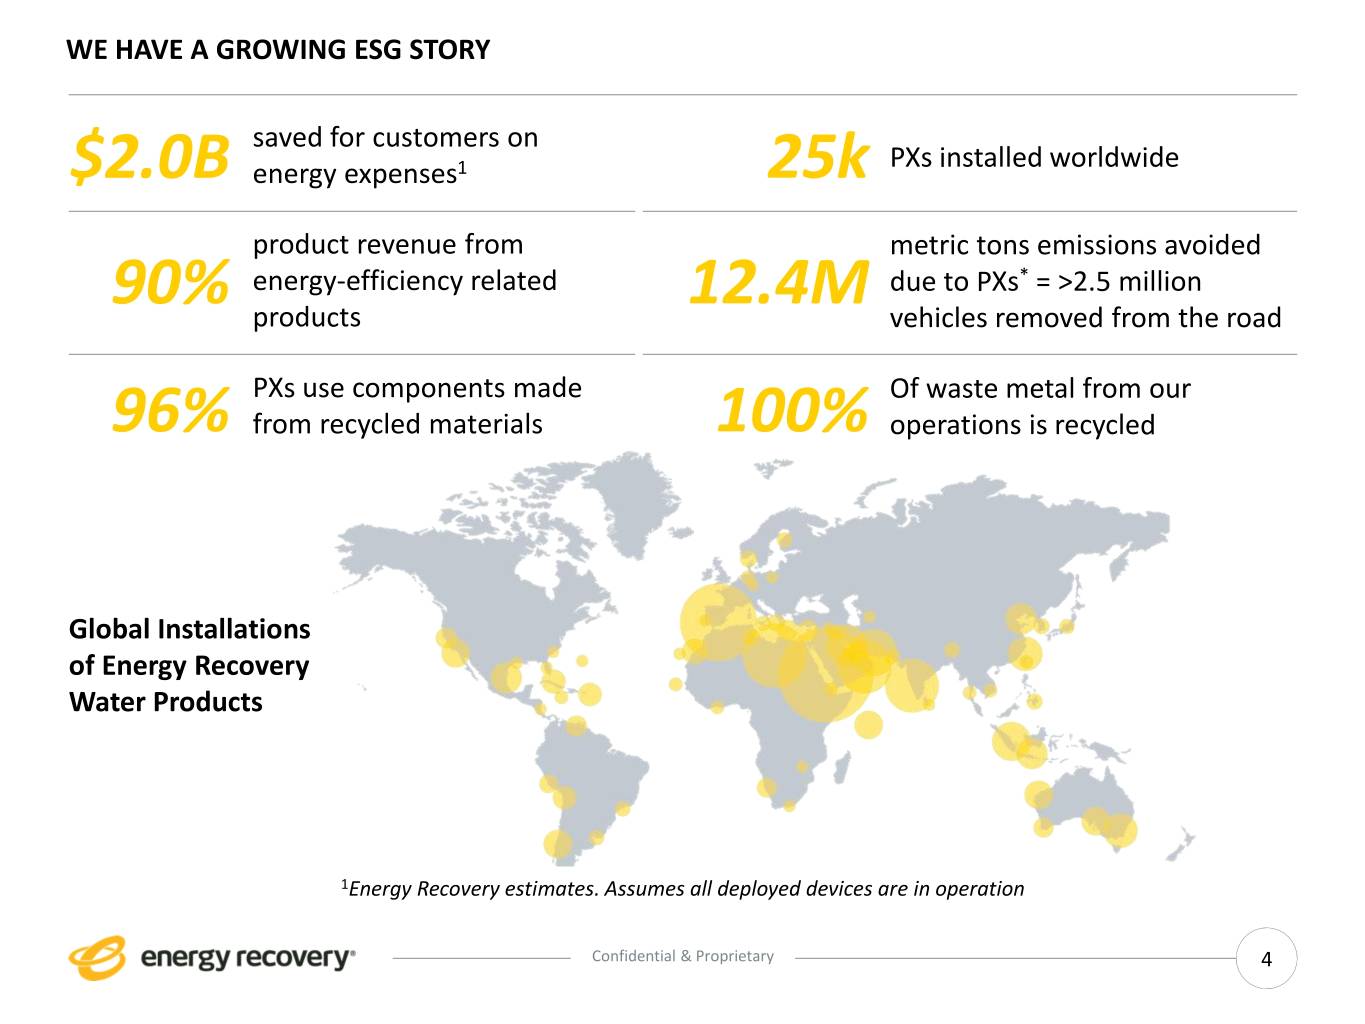
WE HAVE A GROWING ESG STORY saved for customers on PXs installed worldwide $2.0B energy expenses1 25k product revenue from metric tons emissions avoided energy-efficiency related due to PXs* = >2.5 million 90% products 12.4M vehicles removed from the road PXs use components made Of waste metal from our 96% from recycled materials 100% operations is recycled Global Installations of Energy Recovery Water Products 1Energy Recovery estimates. Assumes all deployed devices are in operation Confidential & Proprietary 4
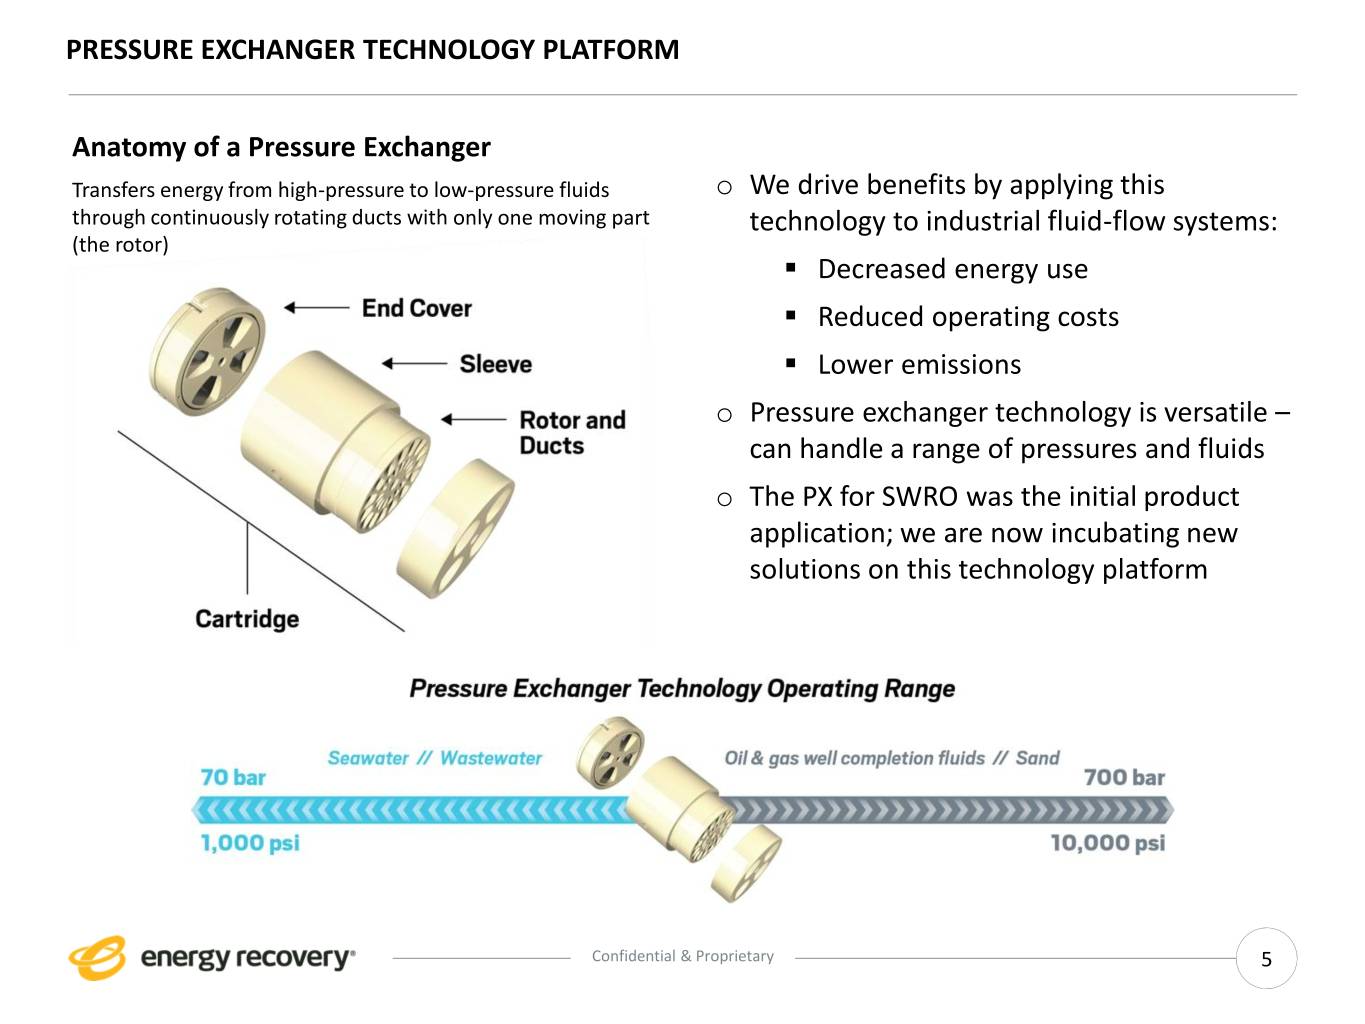
PRESSURE EXCHANGER TECHNOLOGY PLATFORM Anatomy of a Pressure Exchanger Transfers energy from high-pressure to low-pressure fluids o We drive benefits by applying this through continuously rotating ducts with only one moving part technology to industrial fluid-flow systems: (the rotor) ▪ Decreased energy use ▪ Reduced operating costs ▪ Lower emissions o Pressure exchanger technology is versatile – can handle a range of pressures and fluids o The PX for SWRO was the initial product application; we are now incubating new solutions on this technology platform Confidential & Proprietary 5
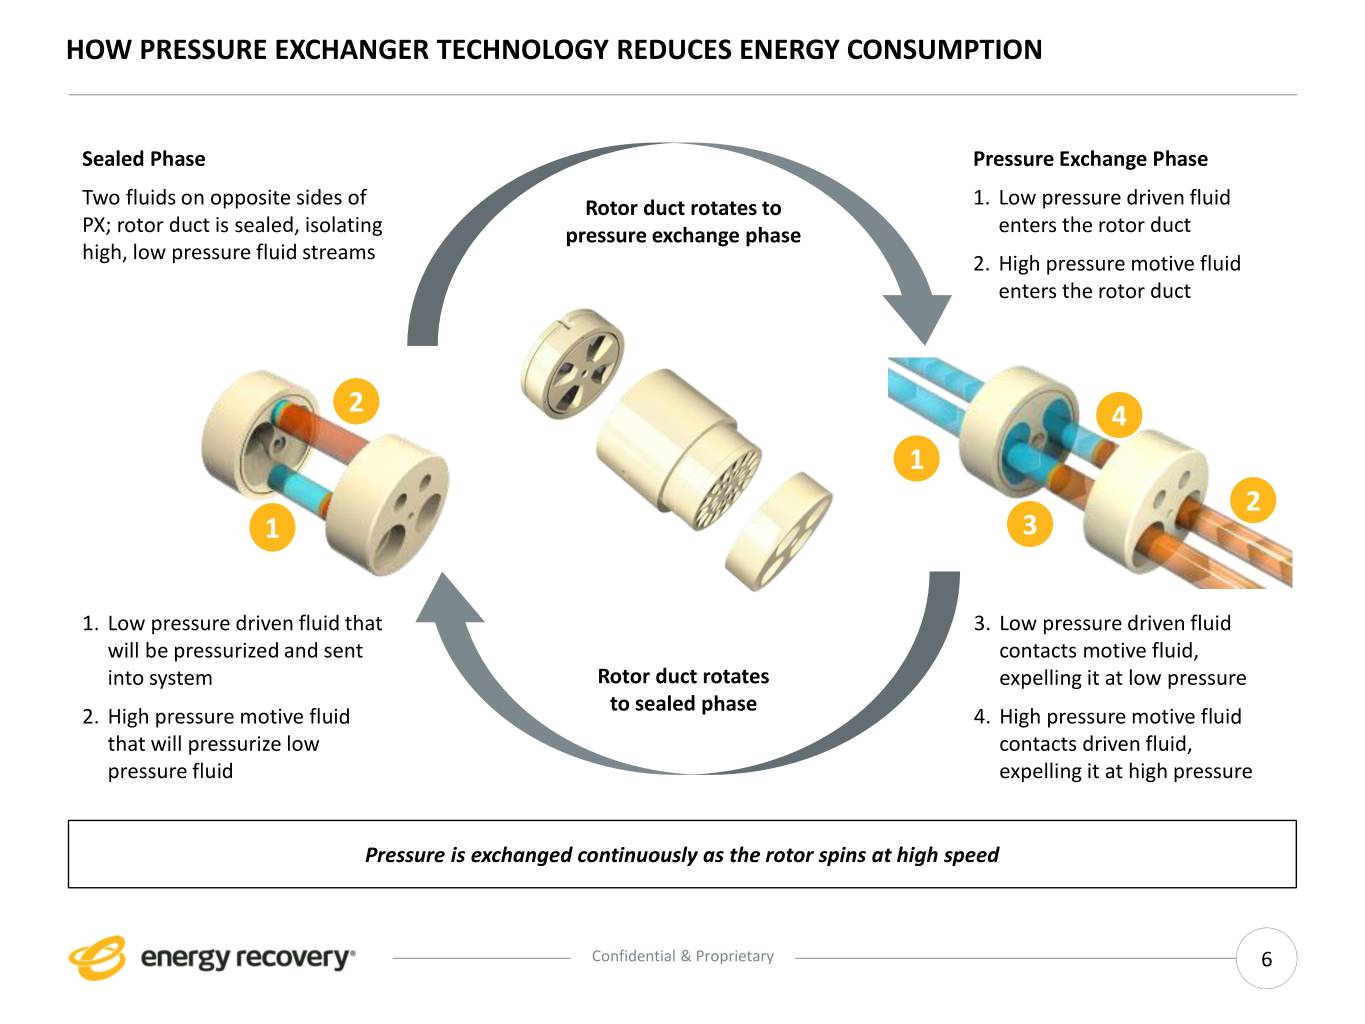
HOW PRESSURE EXCHANGER TECHNOLOGY REDUCES ENERGY CONSUMPTION Sealed Phase Pressure Exchange Phase Two fluids on opposite sides of Rotor duct rotates to 1. Low pressure driven fluid PX; rotor duct is sealed, isolating pressure exchange phase enters the rotor duct high, low pressure fluid streams 2. High pressure motive fluid enters the rotor duct 2 4 1 2 1 3 1. Low pressure driven fluid that 3. Low pressure driven fluid will be pressurized and sent contacts motive fluid, into system Rotor duct rotates expelling it at low pressure to sealed phase 2. High pressure motive fluid 4. High pressure motive fluid that will pressurize low contacts driven fluid, pressure fluid expelling it at high pressure Pressure is exchanged continuously as the rotor spins at high speed Confidential & Proprietary 6
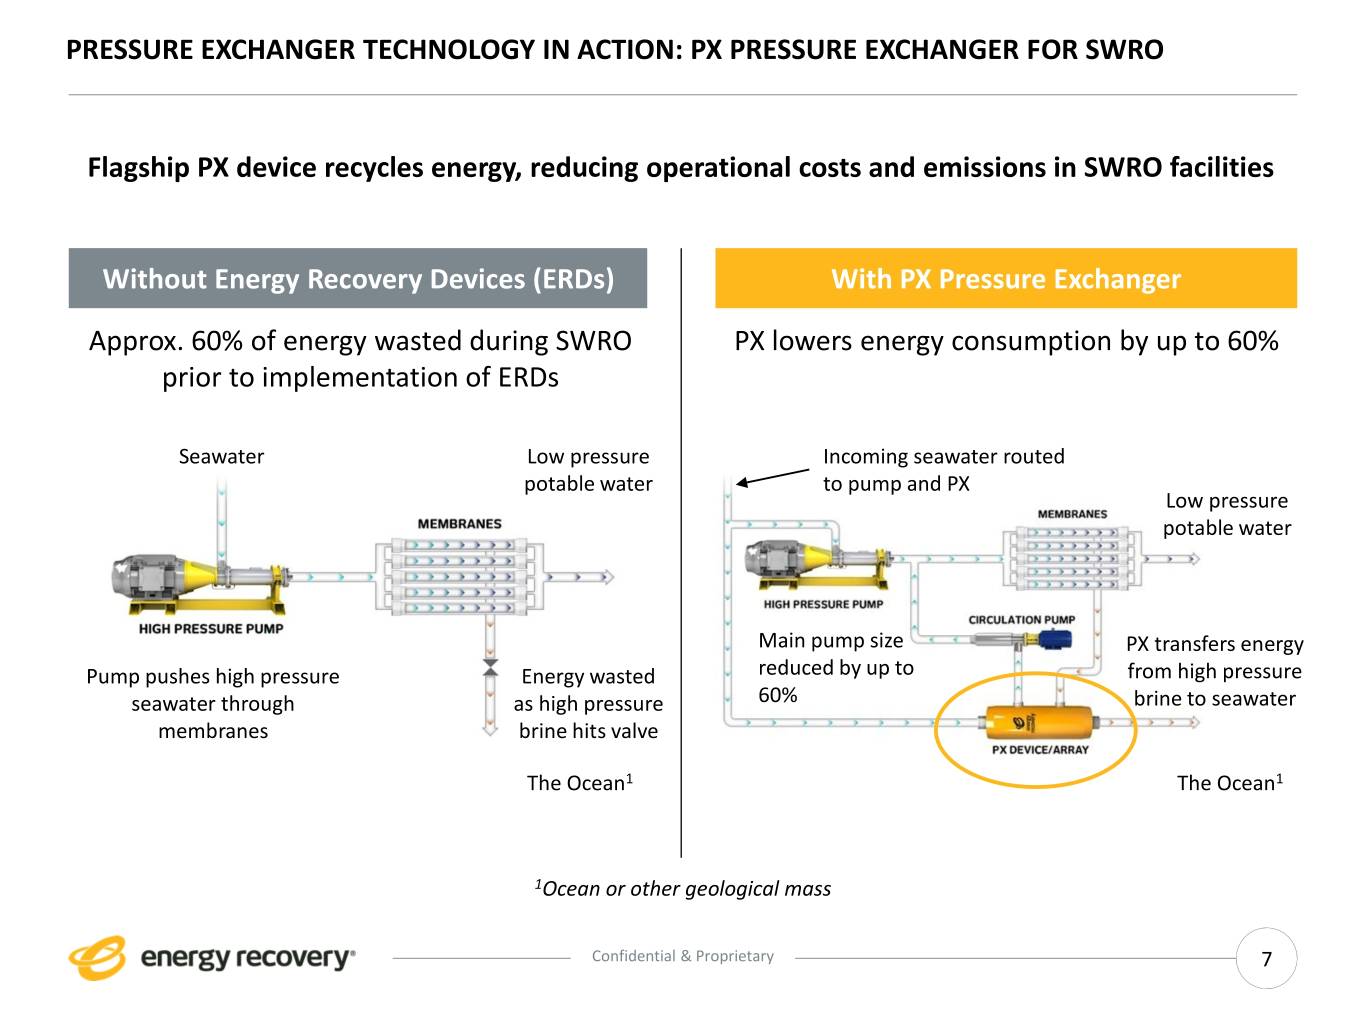
PRESSURE EXCHANGER TECHNOLOGY IN ACTION: PX PRESSURE EXCHANGER FOR SWRO Flagship PX device recycles energy, reducing operational costs and emissions in SWRO facilities Without Energy Recovery Devices (ERDs) With PX Pressure Exchanger Approx. 60% of energy wasted during SWRO PX lowers energy consumption by up to 60% prior to implementation of ERDs Seawater Low pressure Incoming seawater routed potable water to pump and PX Low pressure potable water Main pump size PX transfers energy Pump pushes high pressure Energy wasted reduced by up to from high pressure seawater through as high pressure 60% brine to seawater membranes brine hits valve The Ocean1 The Ocean1 1Ocean or other geological mass Confidential & Proprietary 7
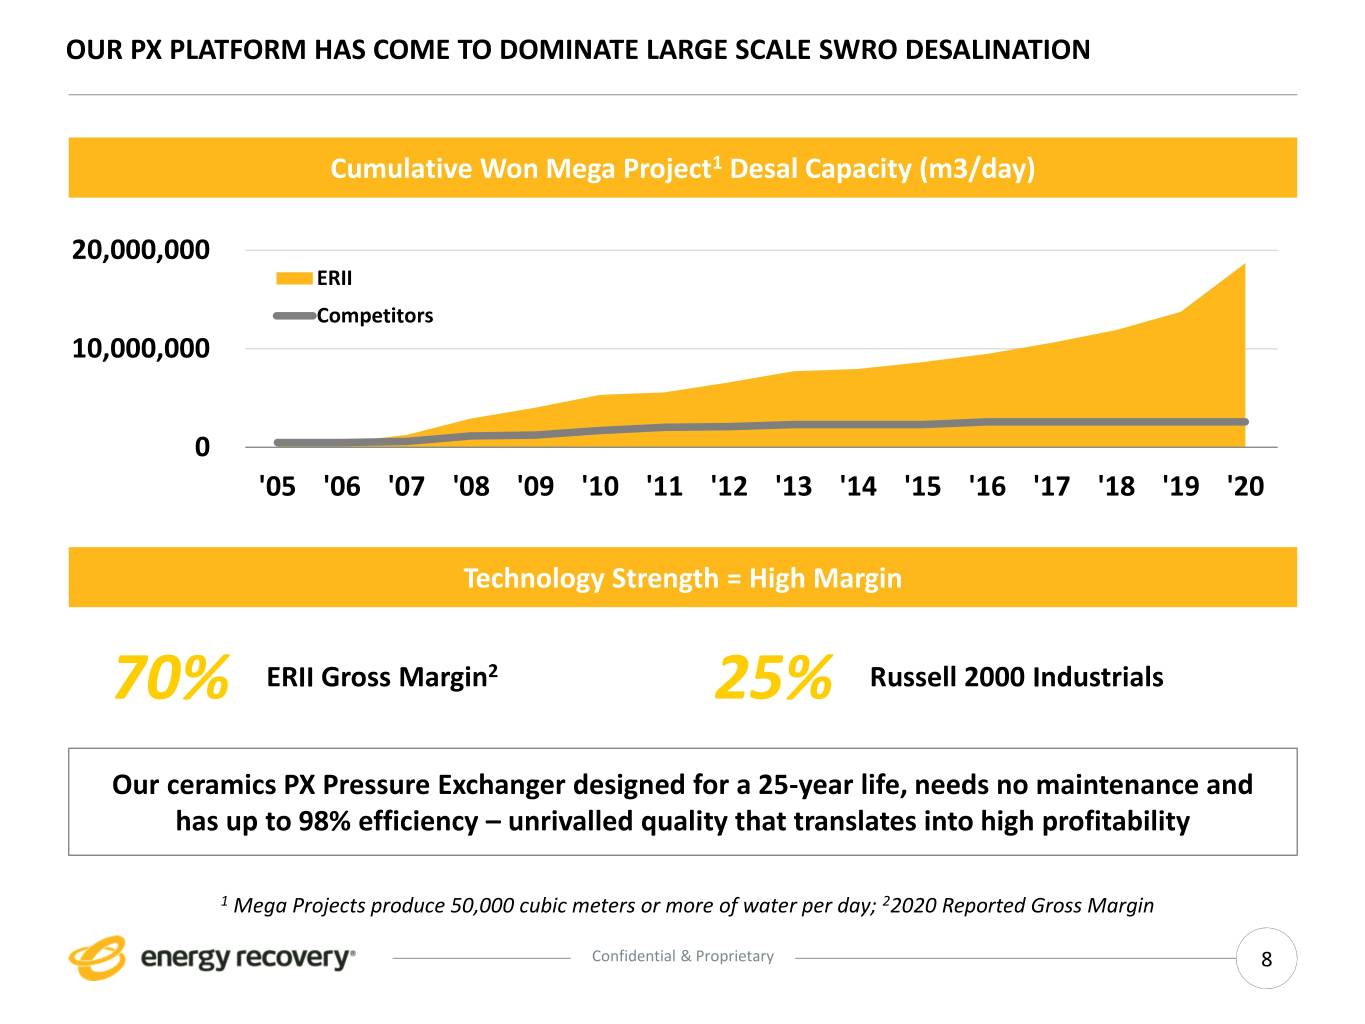
OUR PX PLATFORM HAS COME TO DOMINATE LARGE SCALE SWRO DESALINATION Cumulative Won Mega Project1 Desal Capacity (m3/day) 20,000,000 ERII Competitors 10,000,000 0 '05 '06 '07 '08 '09 '10 '11 '12 '13 '14 '15 '16 '17 '18 '19 '20 Technology Strength = High Margin 70% ERII Gross Margin2 25% Russell 2000 Industrials Our ceramics PX Pressure Exchanger designed for a 25-year life, needs no maintenance and has up to 98% efficiency – unrivalled quality that translates into high profitability 1 Mega Projects produce 50,000 cubic meters or more of water per day; 22020 Reported Gross Margin Confidential & Proprietary 8
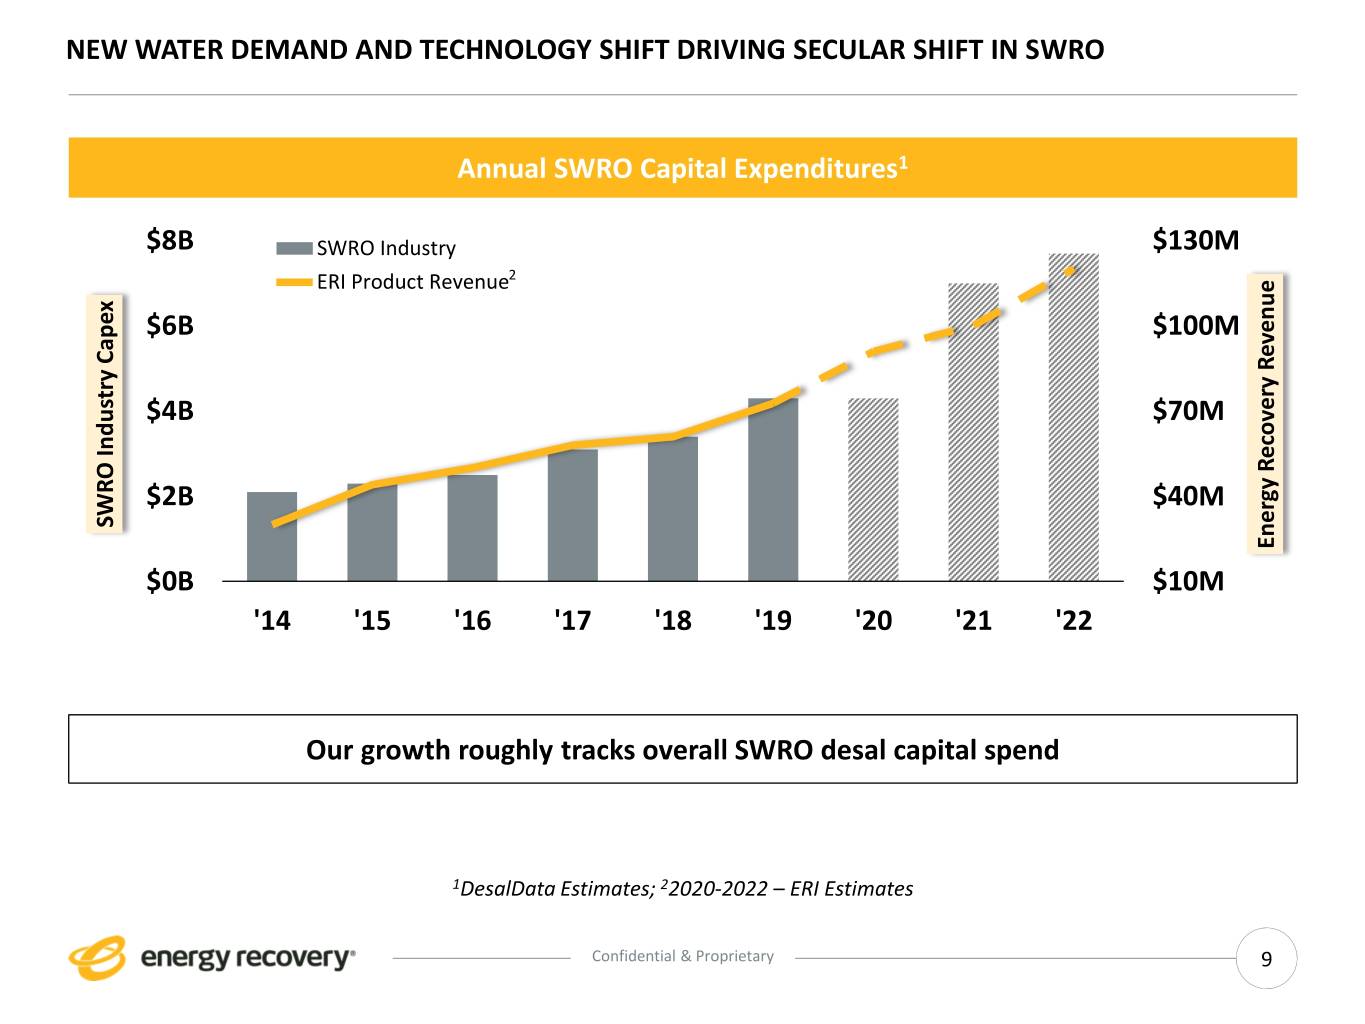
NEW WATER DEMAND AND TECHNOLOGY SHIFT DRIVING SECULAR SHIFT IN SWRO Annual SWRO Capital Expenditures1 $8B SWRO Industry $130M ERI Product Revenue2 $6B $100M $4B $70M $2B $40M SWRO Industry Capex Industry SWRO Energy Recovery Revenue Recovery Energy $0B $10M '14 '15 '16 '17 '18 '19 '20 '21 '22 Our growth roughly tracks overall SWRO desal capital spend 1DesalData Estimates; 22020-2022 – ERI Estimates Confidential & Proprietary 9
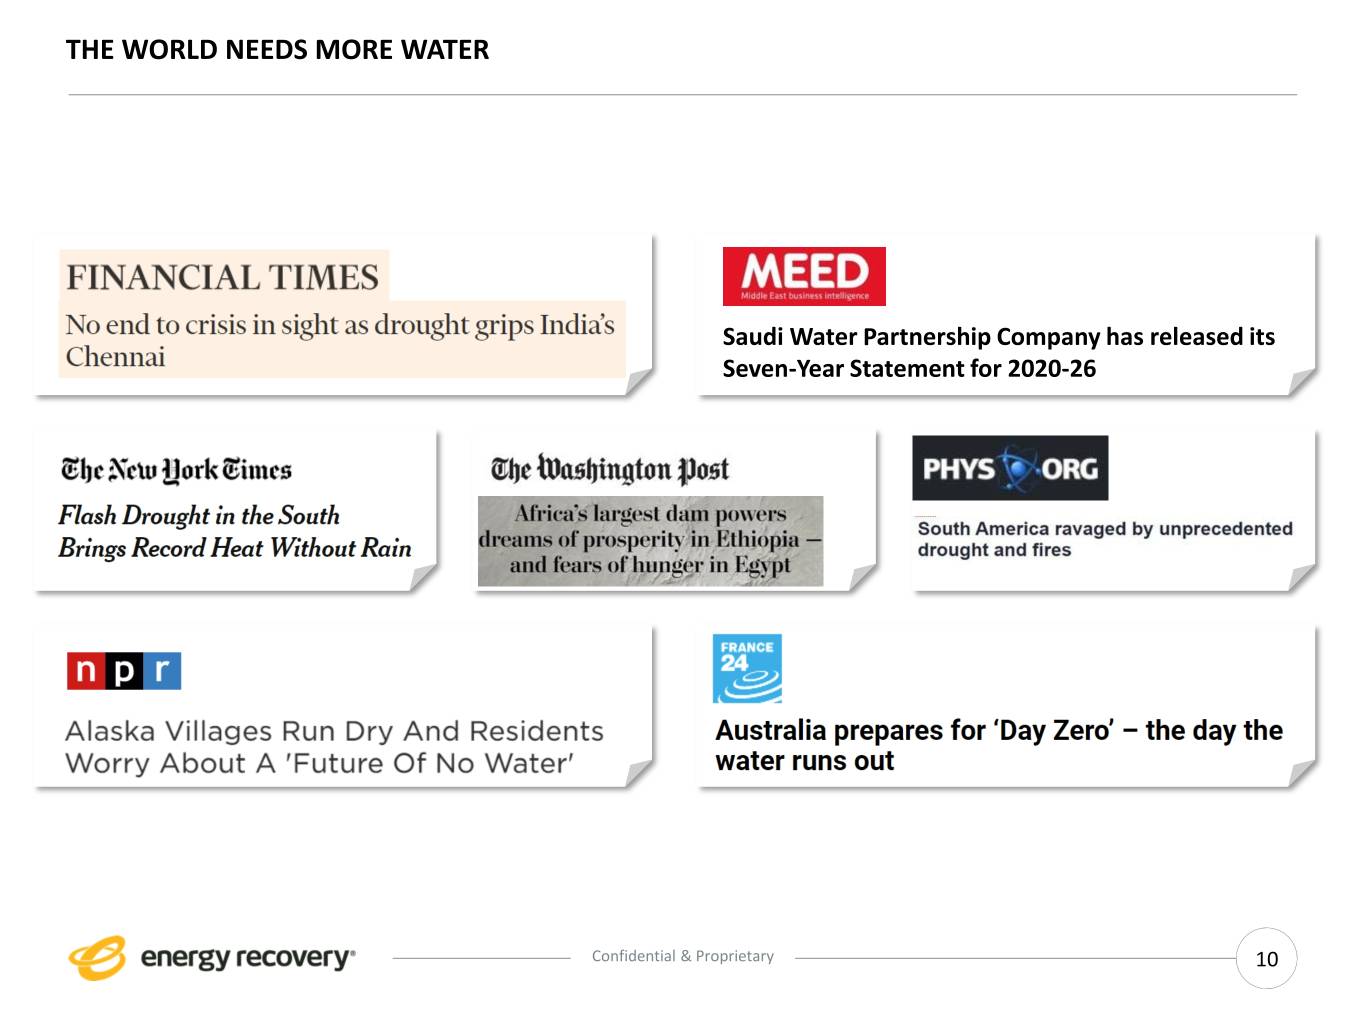
THE WORLD NEEDS MORE WATER Saudi Water Partnership Company has released its Seven-Year Statement for 2020-26 Confidential & Proprietary 10
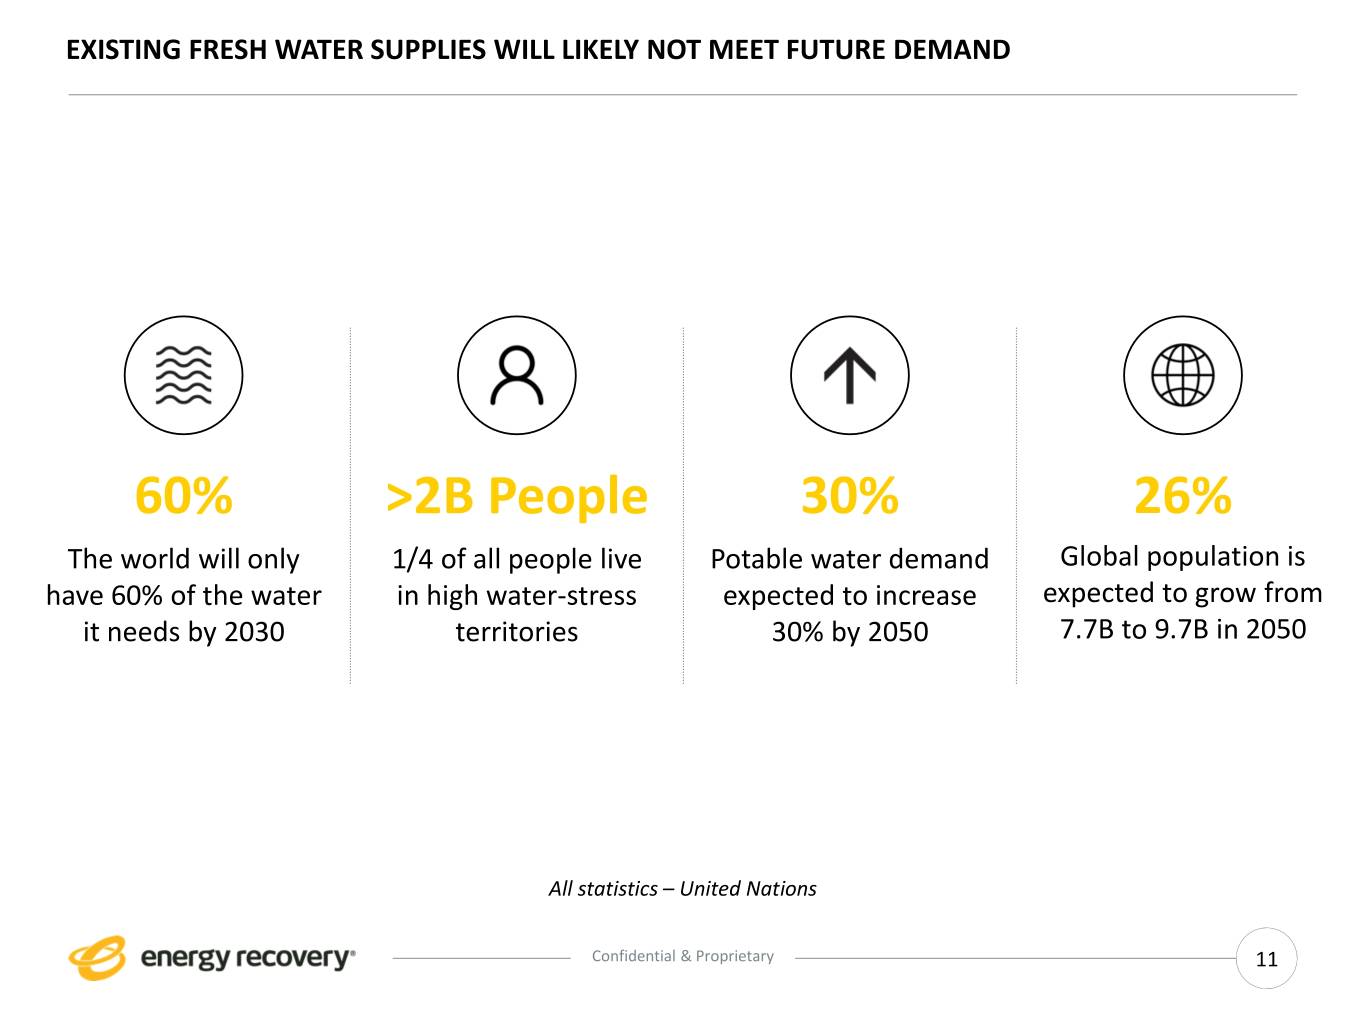
EXISTING FRESH WATER SUPPLIES WILL LIKELY NOT MEET FUTURE DEMAND 60% >2B People 30% 26% The world will only 1/4 of all people live Potable water demand Global population is have 60% of the water in high water-stress expected to increase expected to grow from it needs by 2030 territories 30% by 2050 7.7B to 9.7B in 2050 All statistics – United Nations Confidential & Proprietary 11
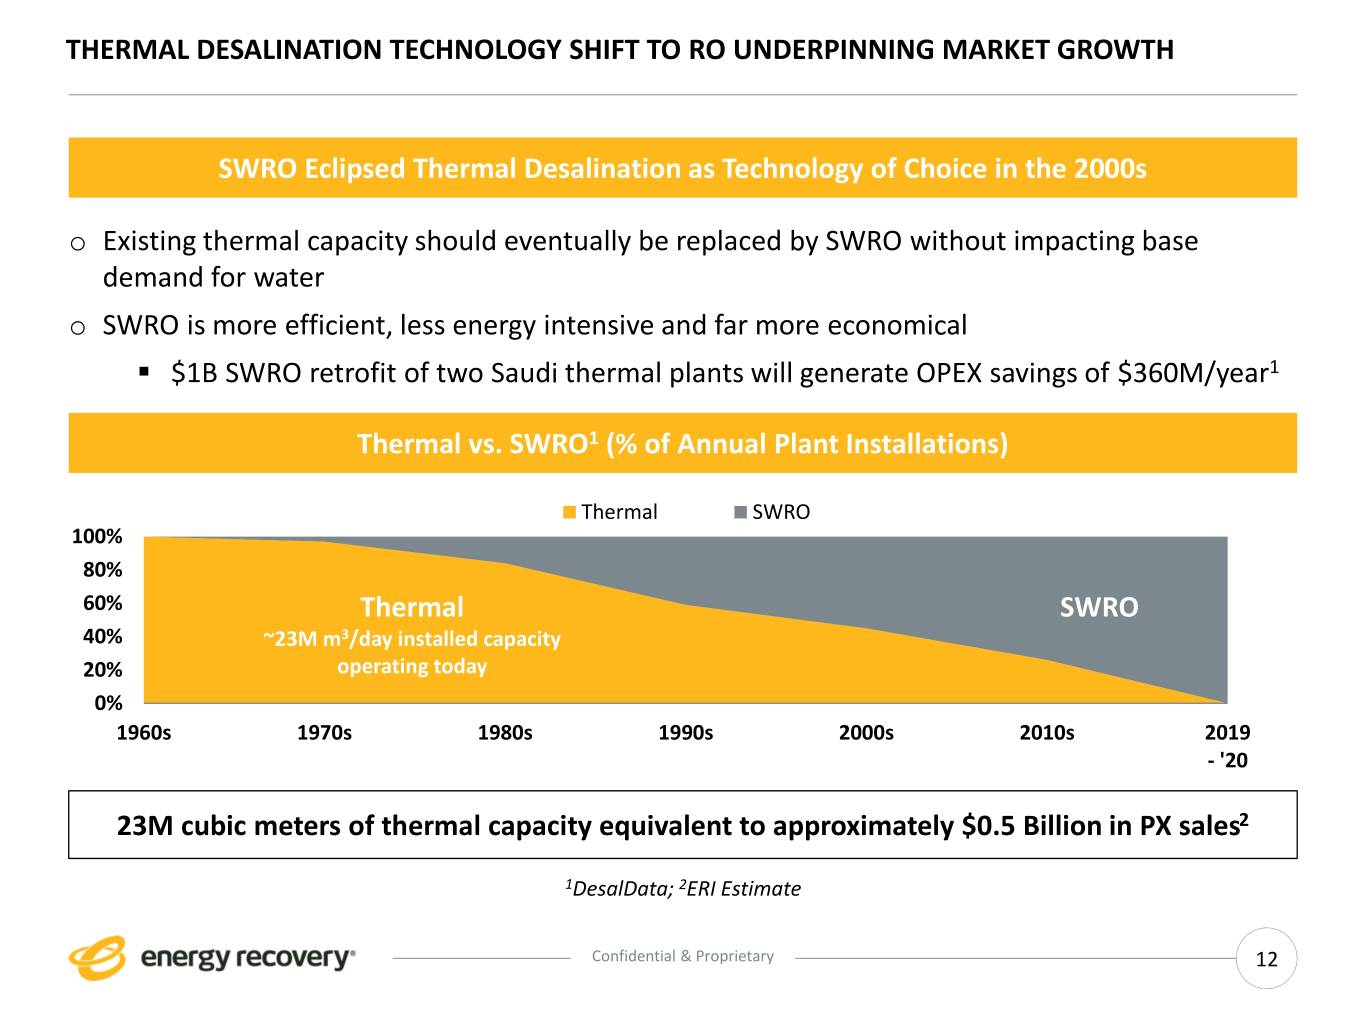
THERMAL DESALINATION TECHNOLOGY SHIFT TO RO UNDERPINNING MARKET GROWTH SWRO Eclipsed Thermal Desalination as Technology of Choice in the 2000s o Existing thermal capacity should eventually be replaced by SWRO without impacting base demand for water o SWRO is more efficient, less energy intensive and far more economical ▪ $1B SWRO retrofit of two Saudi thermal plants will generate OPEX savings of $360M/year1 ThermalThermal vs. SWRO vs. SWRO1 (%1 of Annual Plant Installations) (% of Annual Plant Installations) Thermal SWRO 100% 80% 60% Thermal SWRO 40% ~23M m3/day installed capacity 20% operating today 0% 1960s 1970s 1980s 1990s 2000s 2010s 2019 - '20 23M cubic meters of thermal capacity equivalent to approximately $0.5 Billion in PX sales2 1DesalData; 2ERI Estimate Confidential & Proprietary 12
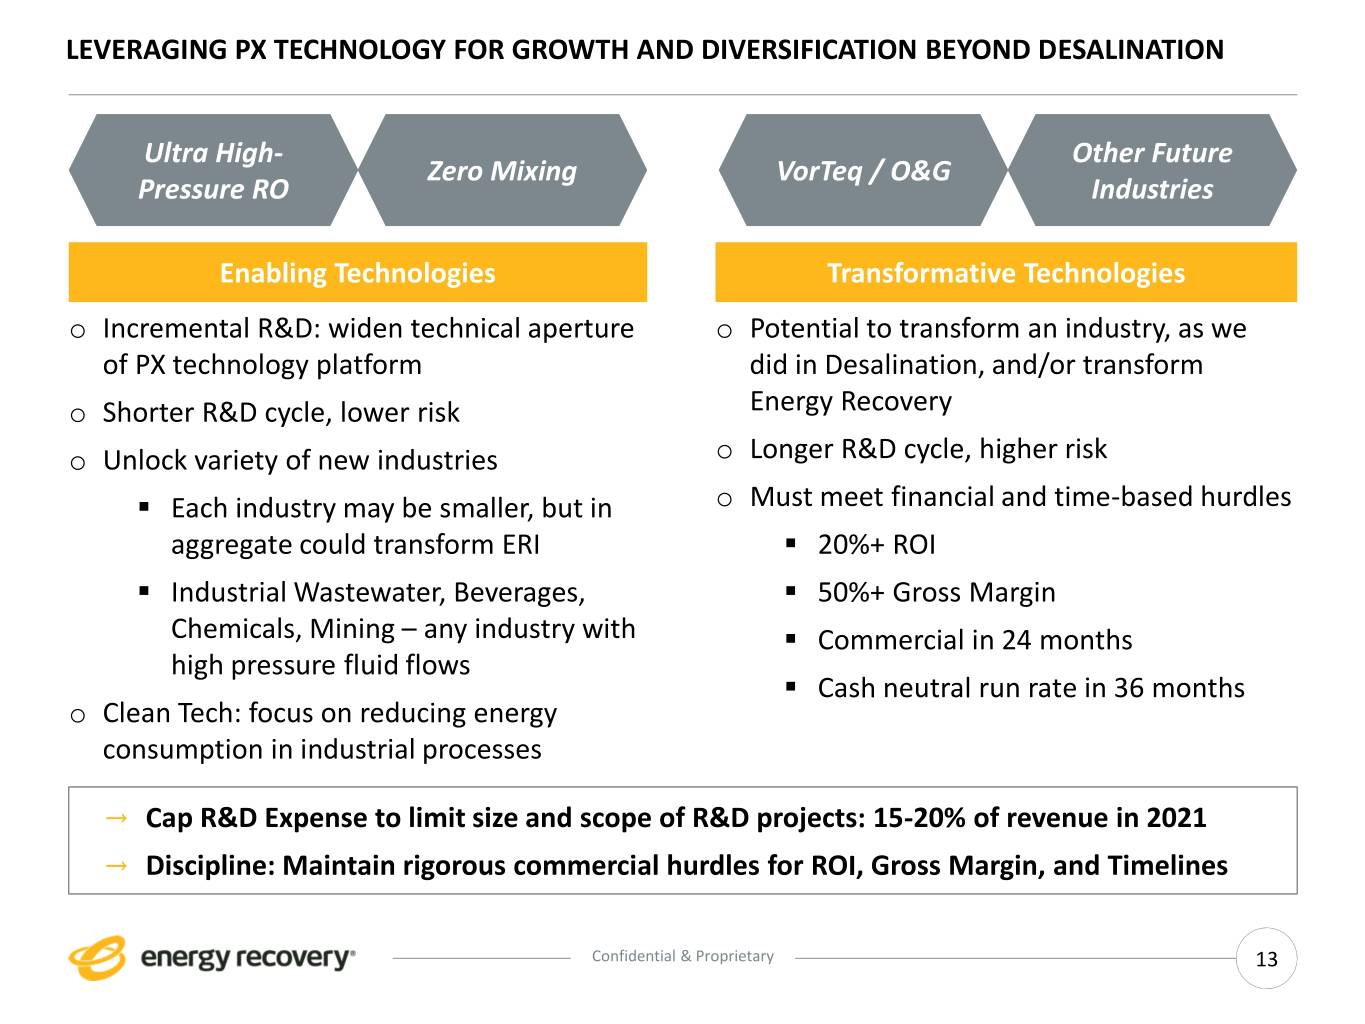
LEVERAGING PX TECHNOLOGY FOR GROWTH AND DIVERSIFICATION BEYOND DESALINATION Ultra High- Other Future Zero Mixing VorTeq / O&G Pressure RO Industries Enabling Technologies Transformative Technologies o Incremental R&D: widen technical aperture o Potential to transform an industry, as we of PX technology platform did in Desalination, and/or transform o Shorter R&D cycle, lower risk Energy Recovery o Unlock variety of new industries o Longer R&D cycle, higher risk ▪ Each industry may be smaller, but in o Must meet financial and time-based hurdles aggregate could transform ERI ▪ 20%+ ROI ▪ Industrial Wastewater, Beverages, ▪ 50%+ Gross Margin Chemicals, Mining – any industry with ▪ Commercial in 24 months high pressure fluid flows ▪ Cash neutral run rate in 36 months o Clean Tech: focus on reducing energy consumption in industrial processes → Cap R&D Expense to limit size and scope of R&D projects: 15-20% of revenue in 2021 → Discipline: Maintain rigorous commercial hurdles for ROI, Gross Margin, and Timelines Confidential & Proprietary 13
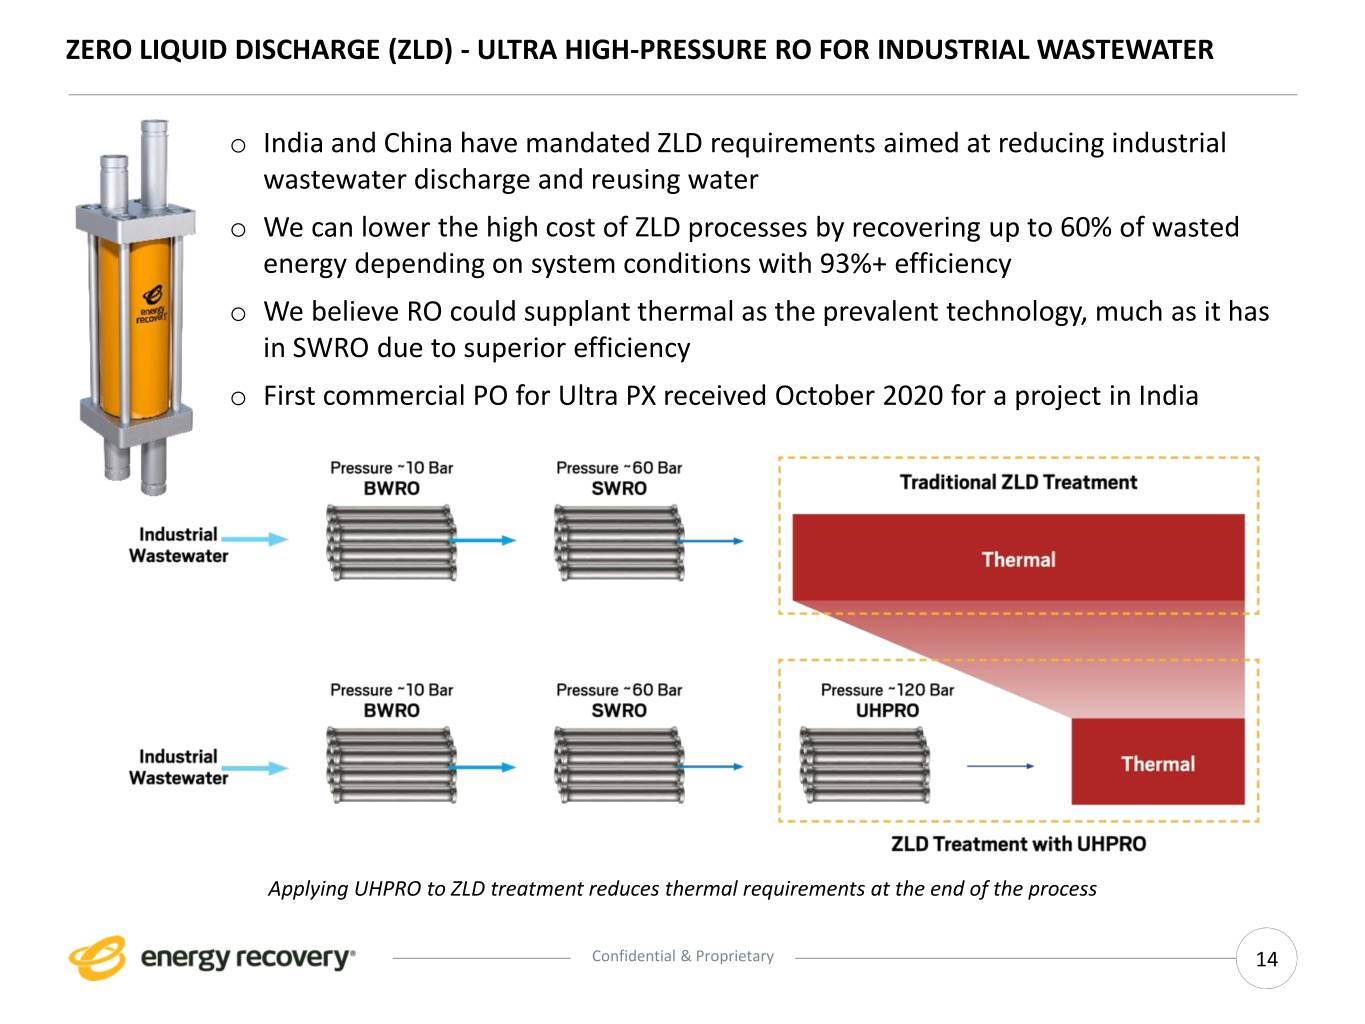
ZERO LIQUID DISCHARGE (ZLD) - ULTRA HIGH-PRESSURE RO FOR INDUSTRIAL WASTEWATER o India and China have mandated ZLD requirements aimed at reducing industrial wastewater discharge and reusing water o We can lower the high cost of ZLD processes by recovering up to 60% of wasted energy depending on system conditions with 93%+ efficiency o We believe RO could supplant thermal as the prevalent technology, much as it has in SWRO due to superior efficiency o First commercial PO for Ultra PX received October 2020 for a project in India Applying UHPRO to ZLD treatment reduces thermal requirements at the end of the process Confidential & Proprietary 14
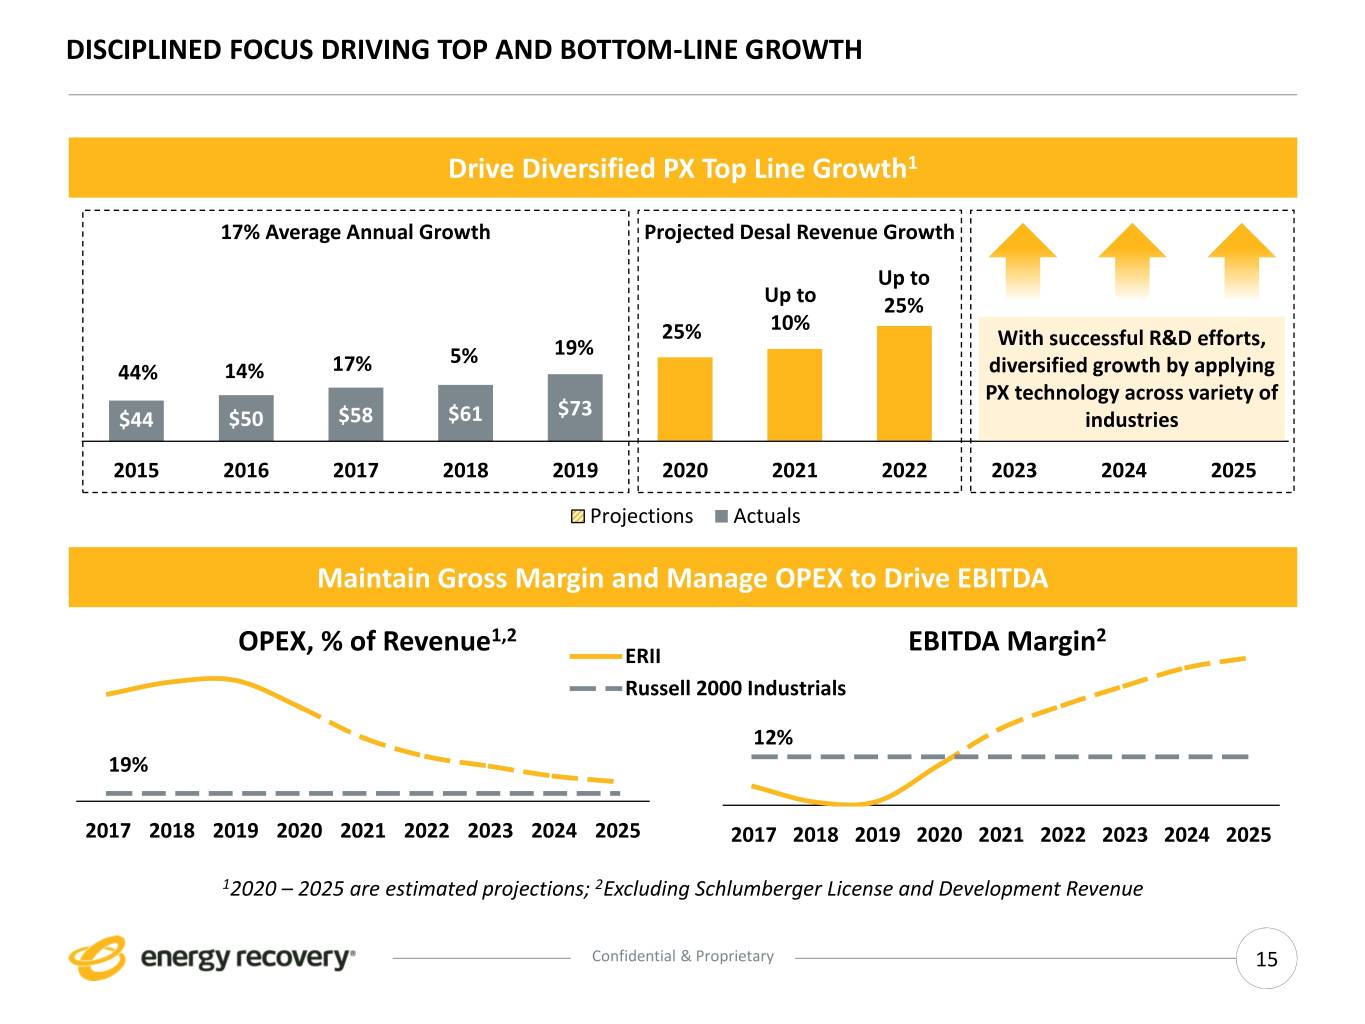
DISCIPLINED FOCUS DRIVING TOP AND BOTTOM-LINE GROWTH Drive Diversified PX Top Line Growth1 17% Average Annual Growth Projected Desal Revenue Growth Up to Up to 25% 10% 25% With successful R&D efforts, 5% 19% z 44% 14% 17% diversified growth by applying PX technology across variety of $73 $44 $50 $58 $61 industries 2015 2016 2017 2018 2019 2020 2021 2022 2023 2024 2025 Projections Actuals Maintain Gross Margin and Manage OPEX to Drive EBITDA 1,2 2 OPEX, % of Revenue ERII EBITDA Margin Russell 2000 Industrials 12% 19% 2017 2018 2019 2020 2021 2022 2023 2024 2025 2017 2018 2019 2020 2021 2022 2023 2024 2025 12020 – 2025 are estimated projections; 2Excluding Schlumberger License and Development Revenue Confidential & Proprietary 15
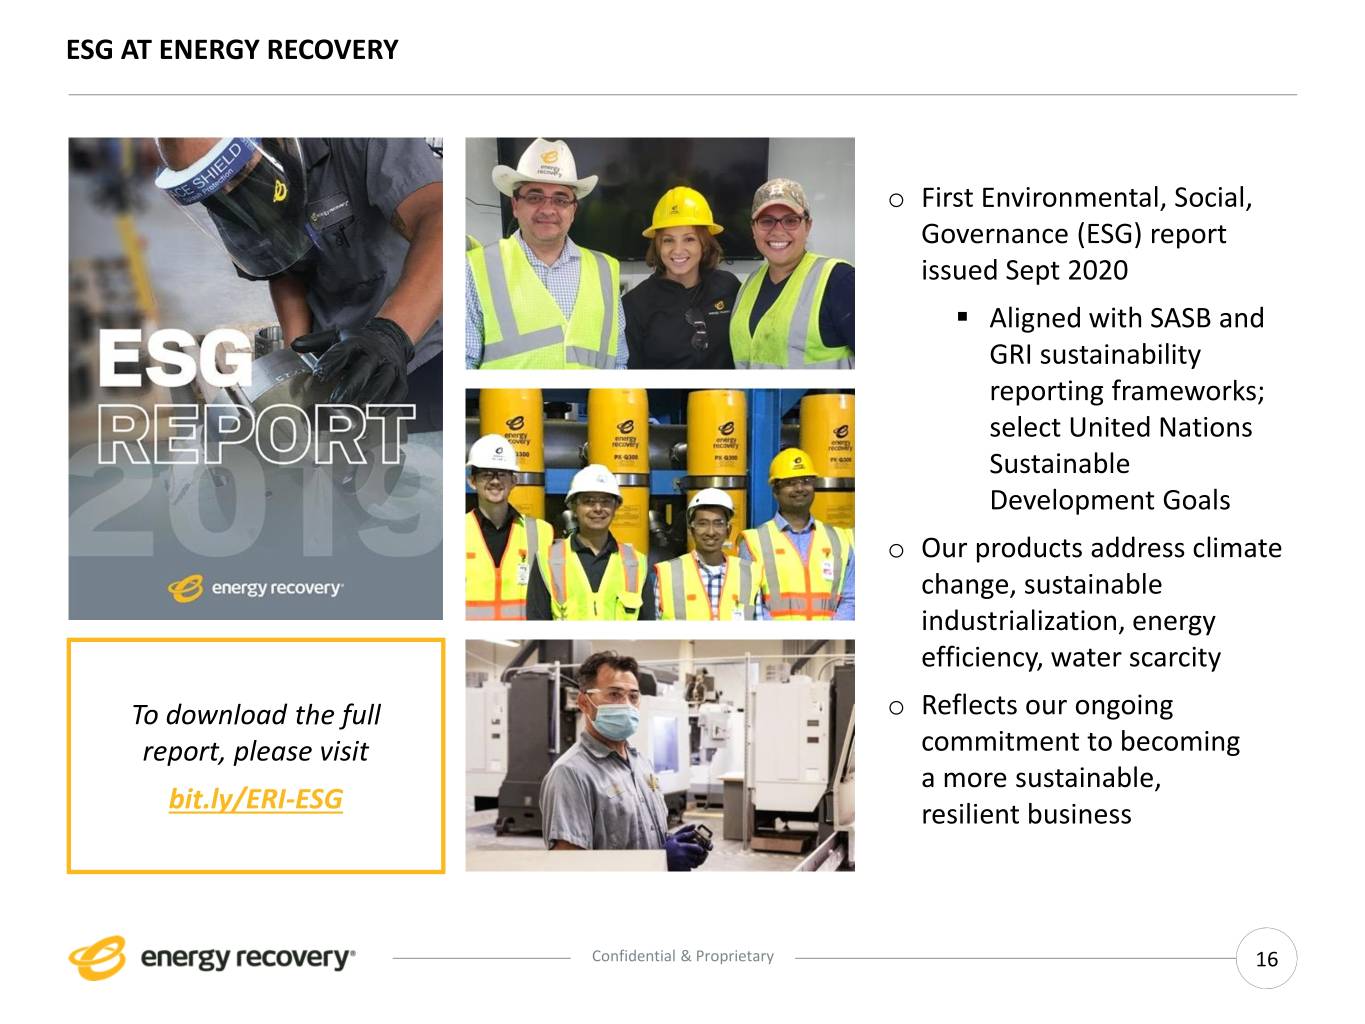
ESG AT ENERGY RECOVERY o First Environmental, Social, Governance (ESG) report issued Sept 2020 ▪ Aligned with SASB and GRI sustainability reporting frameworks; select United Nations Sustainable Development Goals o Our products address climate change, sustainable industrialization, energy efficiency, water scarcity To download the full o Reflects our ongoing report, please visit commitment to becoming a more sustainable, bit.ly/ERI-ESG resilient business Confidential & Proprietary 16
Thank You
CONTACT US Joshua Ballard, CFA, CMA Energy Recovery, Inc. +1 510.483.7370 | Office 1717 Doolittle Drive jballard@energyrecovery.com San Leandro, CA 94577, USA ESG@energyrecovery.com energyrecovery.com (for ESG inquiries) Confidential & Proprietary 18