ERI INVESTOR PRESENTATION (NASDAQ: ERII) 2018
FORWARD LOOKING STATEMENT This presentation contains forward-looking statements within the “Safe Harbor” provisions of the Private Securities Litigation Reform Act of 1995. Forward-looking statements in this report include, but are not limited to, statements about our expectations, objectives, anticipations, plans, hopes, beliefs, intentions, or strategies regarding the future. Forward-looking statements that represent our current expectations about future events are based on assumptions and involve risks and uncertainties. If the risks or uncertainties occur or the assumptions prove incorrect, then our results may differ materially from those set forth or implied by the forward-looking statements. Our forward-looking statements are not guarantees of future performance or events. Words such as “expects,” “anticipates,” “believes,” “estimates,” variations of such words, and similar expressions are also intended to identify such forward-looking statements. These forward-looking statements are subject to risks, uncertainties, and assumptions that are difficult to predict; therefore, actual results may differ materially and adversely from those expressed in any forward-looking statements. You should not place undue reliance on these forward-looking statements, which reflect management’s opinions only as of the date of this presentation. All forward-looking statements included in this presentation are subject to certain risks and uncertainties, which could cause actual results to differ materially from those projected in the forward-looking statements, as disclosed from time to time in our reports on Forms 10-K, 10-Q, and 8-K as well as in our Annual Reports to Stockholders and, if necessary, updated in our quarterly reports on Form 10 Q or in other filings. We assume no obligation to update any such forward-looking statements. It is important to note that our actual results could differ materially from the results set forth or implied by our forward-looking statements. Page 2
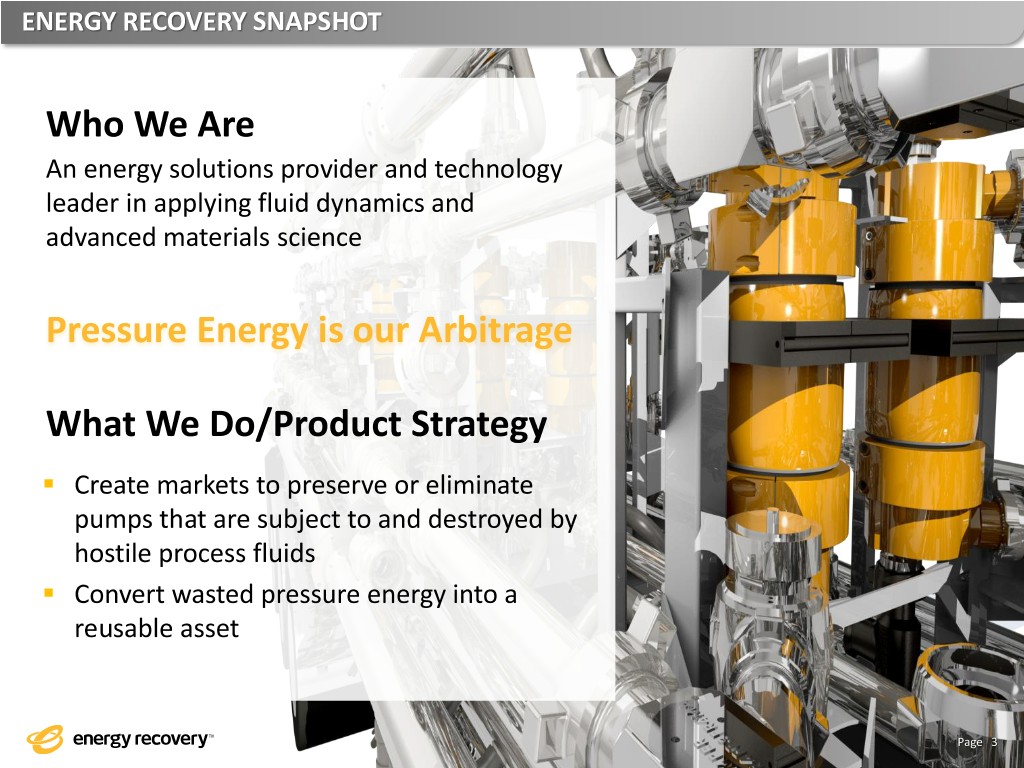
ENERGY RECOVERY SNAPSHOT Who We Are An energy solutions provider and technology leader in applying fluid dynamics and advanced materials science Pressure Energy is our Arbitrage What We Do/Product Strategy ▪ Create markets to preserve or eliminate pumps that are subject to and destroyed by hostile process fluids ▪ Convert wasted pressure energy into a reusable asset Page 3
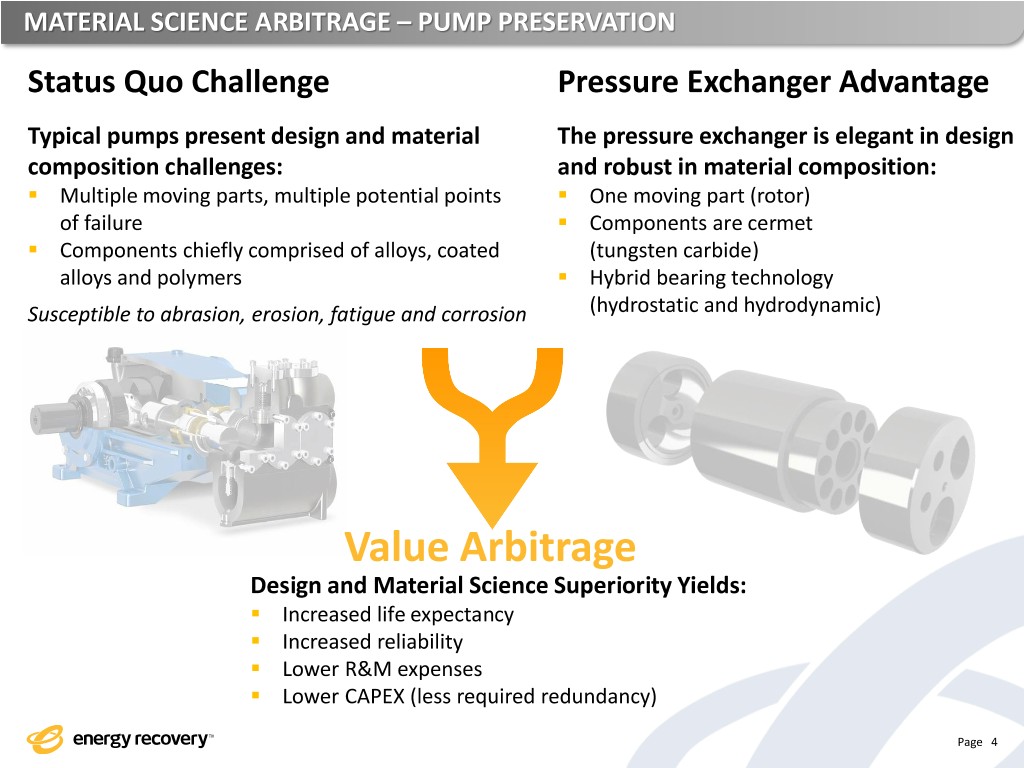
MATERIAL SCIENCE ARBITRAGE – PUMP PRESERVATION Status Quo Challenge Pressure Exchanger Advantage Typical pumps present design and material The pressure exchanger is elegant in design composition challenges: and robust in material composition: ▪ Multiple moving parts, multiple potential points ▪ One moving part (rotor) of failure ▪ Components are cermet ▪ Components chiefly comprised of alloys, coated (tungsten carbide) alloys and polymers ▪ Hybrid bearing technology Susceptible to abrasion, erosion, fatigue and corrosion (hydrostatic and hydrodynamic) Value Arbitrage Design and Material Science Superiority Yields: ▪ Increased life expectancy ▪ Increased reliability ▪ Lower R&M expenses ▪ Lower CAPEX (less required redundancy) Page 4
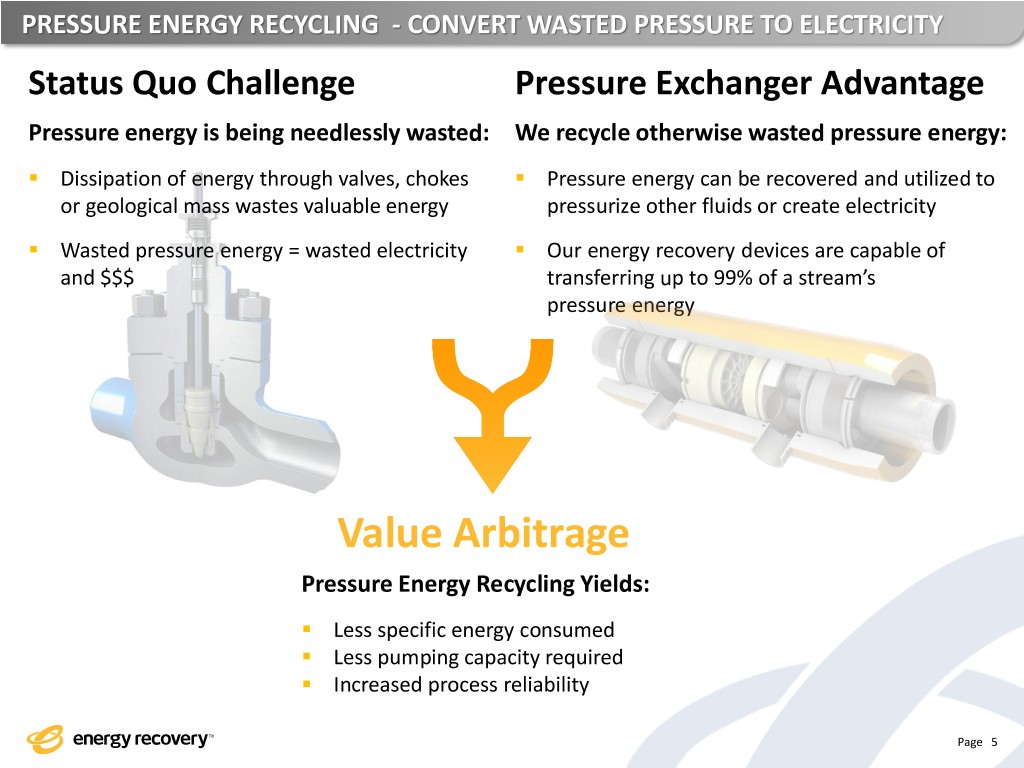
PRESSURE ENERGY RECYCLING - CONVERT WASTED PRESSURE TO ELECTRICITY Status Quo Challenge Pressure Exchanger Advantage Pressure energy is being needlessly wasted: We recycle otherwise wasted pressure energy: ▪ Dissipation of energy through valves, chokes ▪ Pressure energy can be recovered and utilized to or geological mass wastes valuable energy pressurize other fluids or create electricity ▪ Wasted pressure energy = wasted electricity ▪ Our energy recovery devices are capable of and $$$ transferring up to 99% of a stream’s pressure energy Value Arbitrage Pressure Energy Recycling Yields: ▪ Less specific energy consumed ▪ Less pumping capacity required ▪ Increased process reliability Page 5
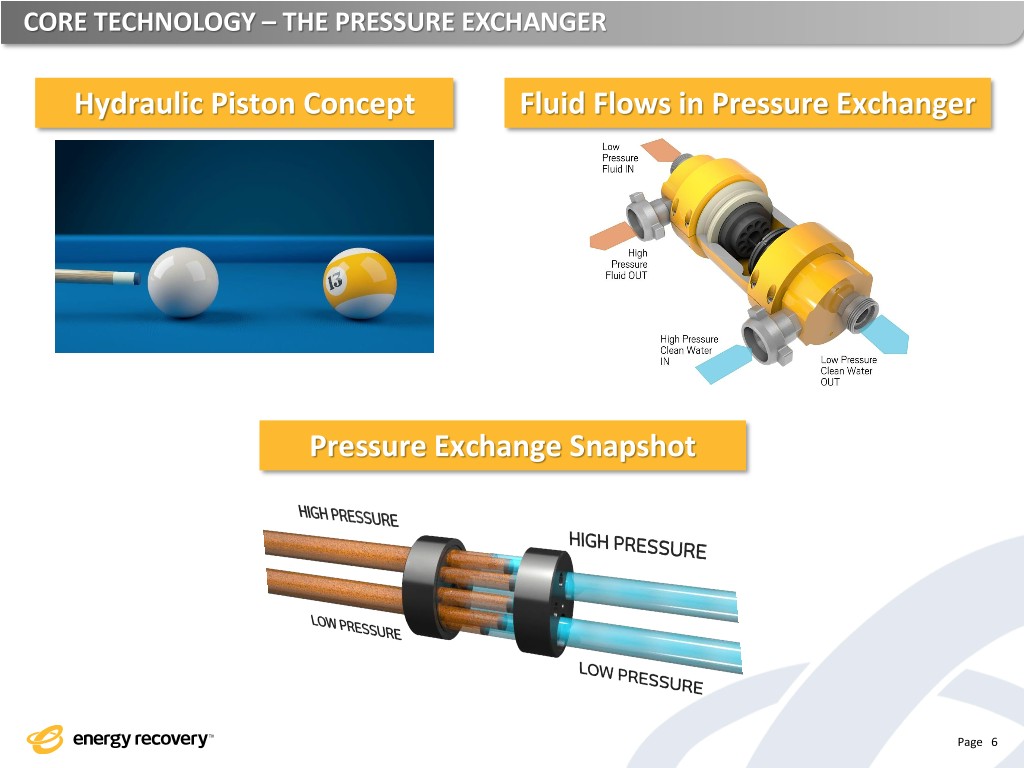
CORE TECHNOLOGY – THE PRESSURE EXCHANGER Hydraulic Piston Concept Fluid Flows in Pressure Exchanger Pressure Exchange Snapshot Page 6
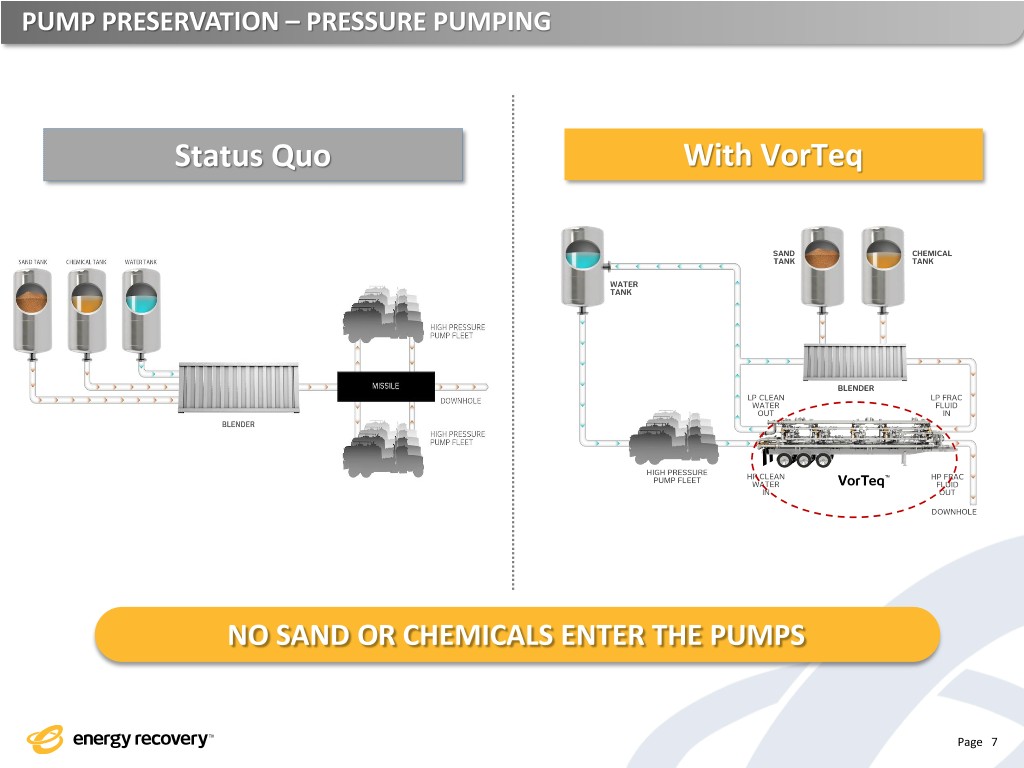
PUMP PRESERVATION – PRESSURE PUMPING Status Quo With VorTeq NO SAND OR CHEMICALS ENTER THE PUMPS Page 7
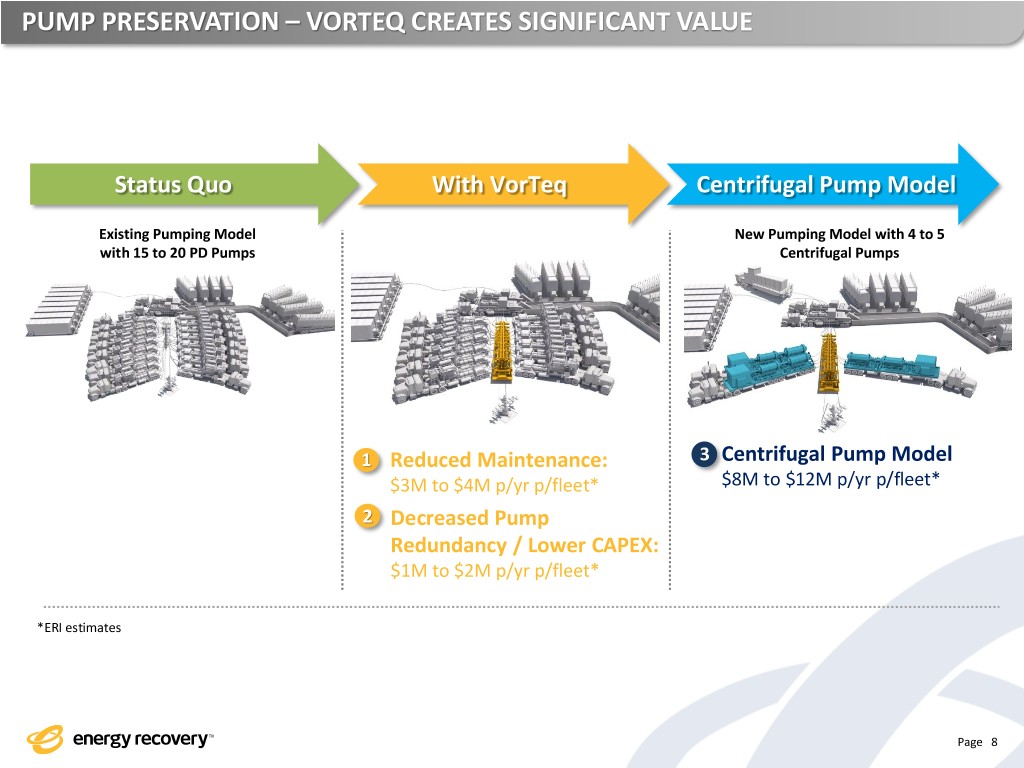
PUMP PRESERVATION – VORTEQ CREATES SIGNIFICANT VALUE Status Quo With VorTeq Centrifugal Pump Model Existing Pumping Model New Pumping Model with 4 to 5 with 15 to 20 PD Pumps Centrifugal Pumps 1 Reduced Maintenance: 3 Centrifugal Pump Model $3M to $4M p/yr p/fleet* $8M to $12M p/yr p/fleet* 2 Decreased Pump Redundancy / Lower CAPEX: $1M to $2M p/yr p/fleet* *ERI estimates Page 8
VORTEQ COMMERCIALIZATION PATH ❖ Commercialization is twofold: ▪ Schlumberger Licensing Agreement • Acceptance standards inclusive of M1 & M2 as well as other performance tests • SLB responsible for missile manufacturing, ERII to provide PXs, housing and motors • Five years from first unit to full deployment of SLB fleet • $1.5MM per VorTeq per year ▪ Liberty has rights for up to 20 VorTeq units • ERII provides full missile and cartridges – vendors have been qualified • Pricing based on contractual ROIC • Performance standards differ and thus speed to market may be faster Page 9
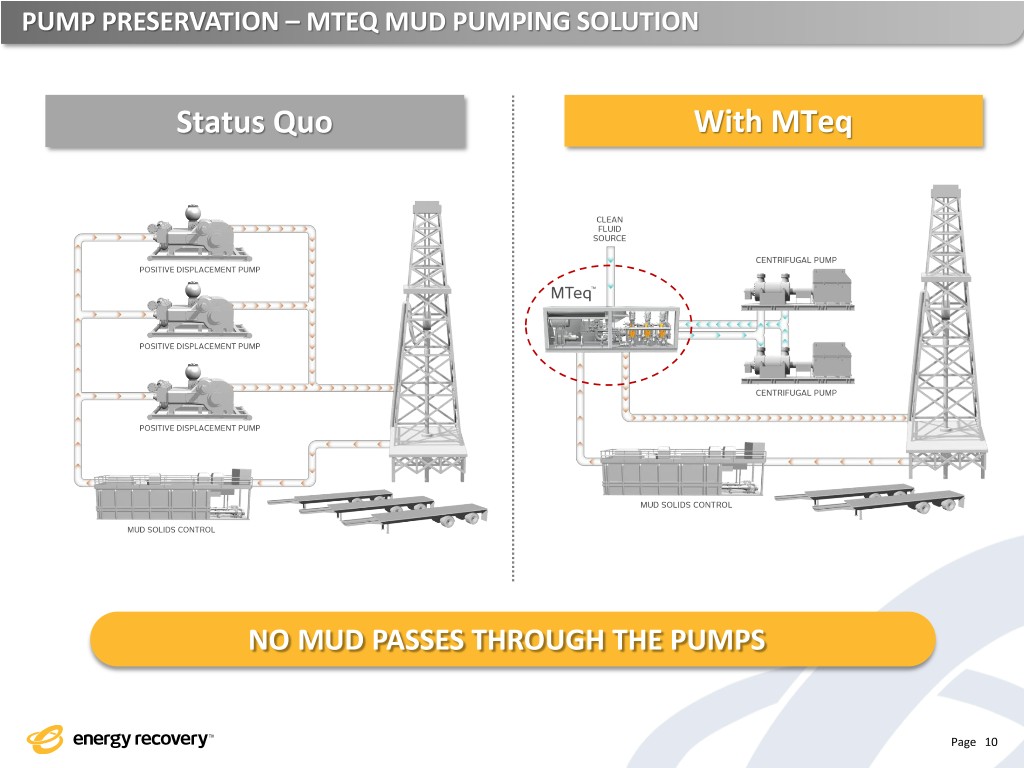
PUMP PRESERVATION – MTEQ MUD PUMPING SOLUTION Status Quo With MTeq NO MUD PASSES THROUGH THE PUMPS Page 10
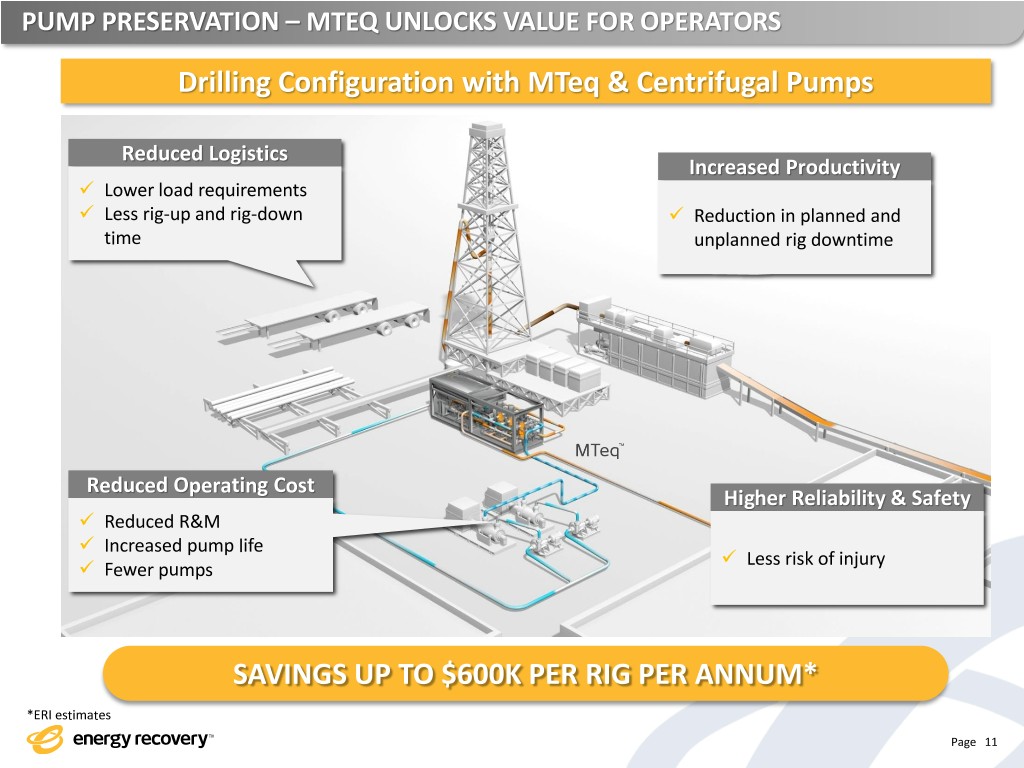
PUMP PRESERVATION – MTEQ UNLOCKS VALUE FOR OPERATORS Drilling Configuration with MTeq & Centrifugal Pumps Reduced Logistics Increased Productivity ✓ Lower load requirements ✓ Less rig-up and rig-down ✓ Reduction in planned and time unplanned rig downtime Reduced Operating Cost Higher Reliability & Safety ✓ Reduced R&M ✓ Increased pump life ✓ Less risk of injury ✓ Fewer pumps SAVINGS UP TO $600K PER RIG PER ANNUM* *ERI estimates Page 11
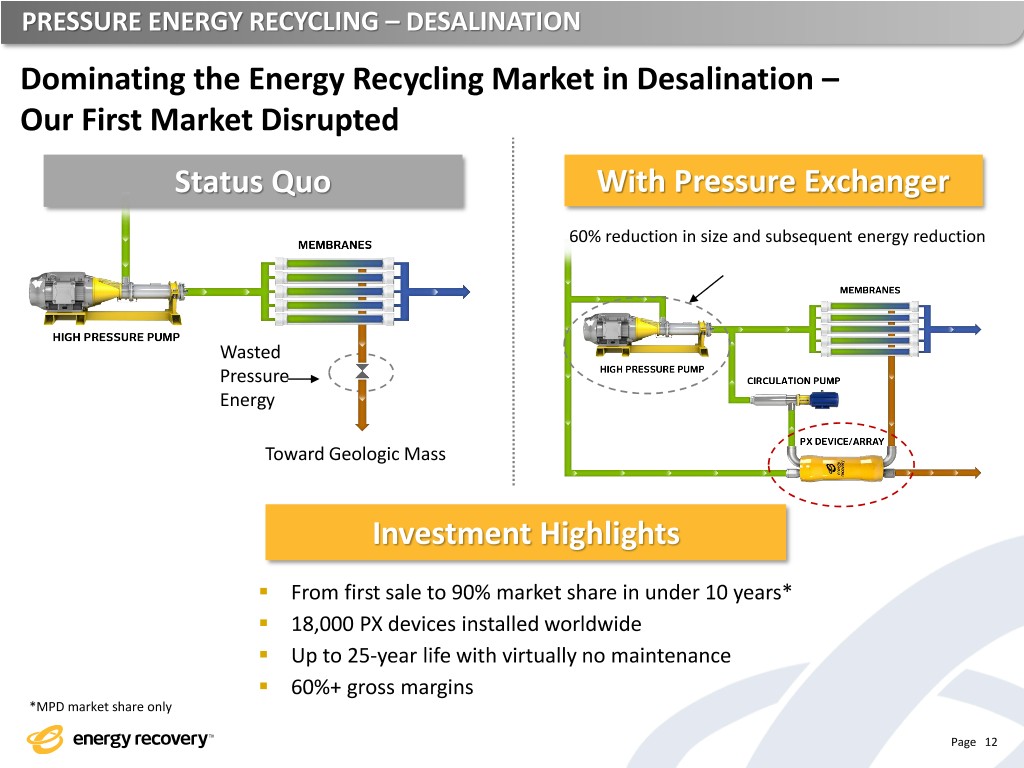
PRESSURE ENERGY RECYCLING – DESALINATION Dominating the Energy Recycling Market in Desalination – Our First Market Disrupted Status Quo With Pressure Exchanger 60% reduction in size and subsequent energy reduction Wasted Pressure Energy Toward Geologic Mass Investment Highlights ▪ From first sale to 90% market share in under 10 years* ▪ 18,000 PX devices installed worldwide ▪ Up to 25-year life with virtually no maintenance ▪ 60%+ gross margins *MPD market share only Page 12
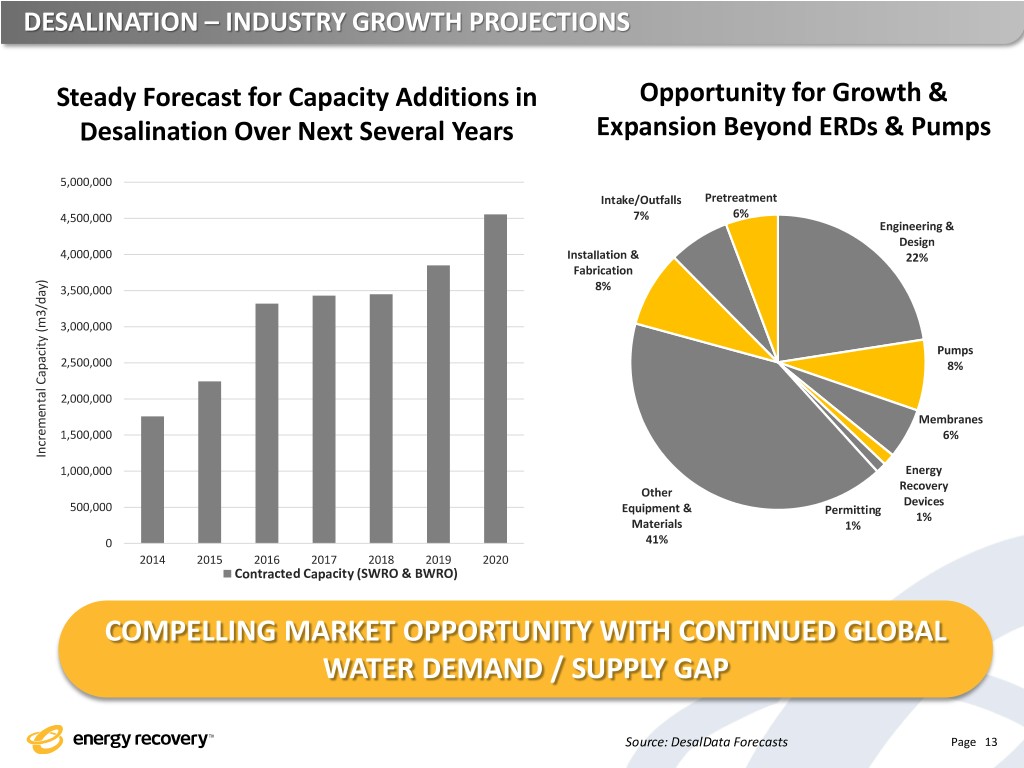
DESALINATION – INDUSTRY GROWTH PROJECTIONS Steady Forecast for Capacity Additions in Opportunity for Growth & Desalination Over Next Several Years Expansion Beyond ERDs & Pumps 5,000,000 Intake/Outfalls Pretreatment 4,500,000 7% 6% Engineering & Design 4,000,000 Installation & 22% Fabrication 3,500,000 8% 3,000,000 Pumps 2,500,000 8% 2,000,000 Membranes 1,500,000 6% Incremental Incremental Capacity(m3/day) 1,000,000 Energy Recovery Other Devices 500,000 Equipment & Permitting 1% Materials 1% 0 41% 2014 2015 2016 2017 2018 2019 2020 Contracted Capacity (SWRO & BWRO) COMPELLING MARKET OPPORTUNITY WITH CONTINUED GLOBAL WATER DEMAND / SUPPLY GAP Source: DesalData Forecasts Page 13
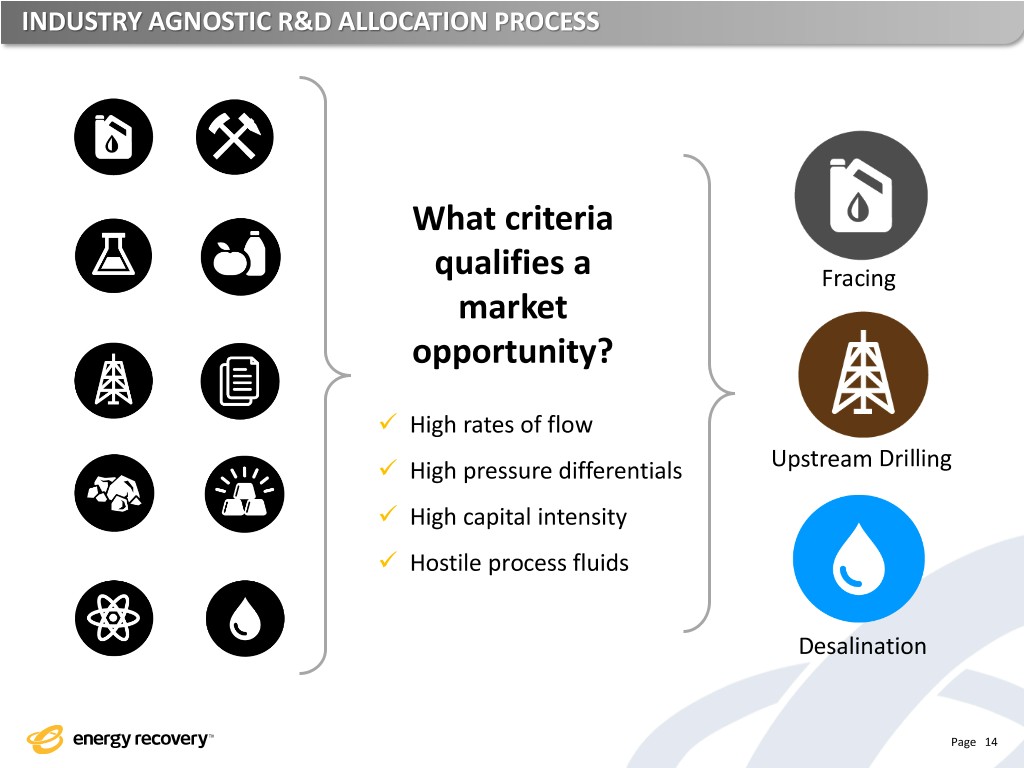
INDUSTRY AGNOSTIC R&D ALLOCATION PROCESS What criteria qualifies a Fracing market opportunity? ✓ High rates of flow ✓ High pressure differentials Upstream Drilling ✓ High capital intensity ✓ Hostile process fluids Desalination Page 14
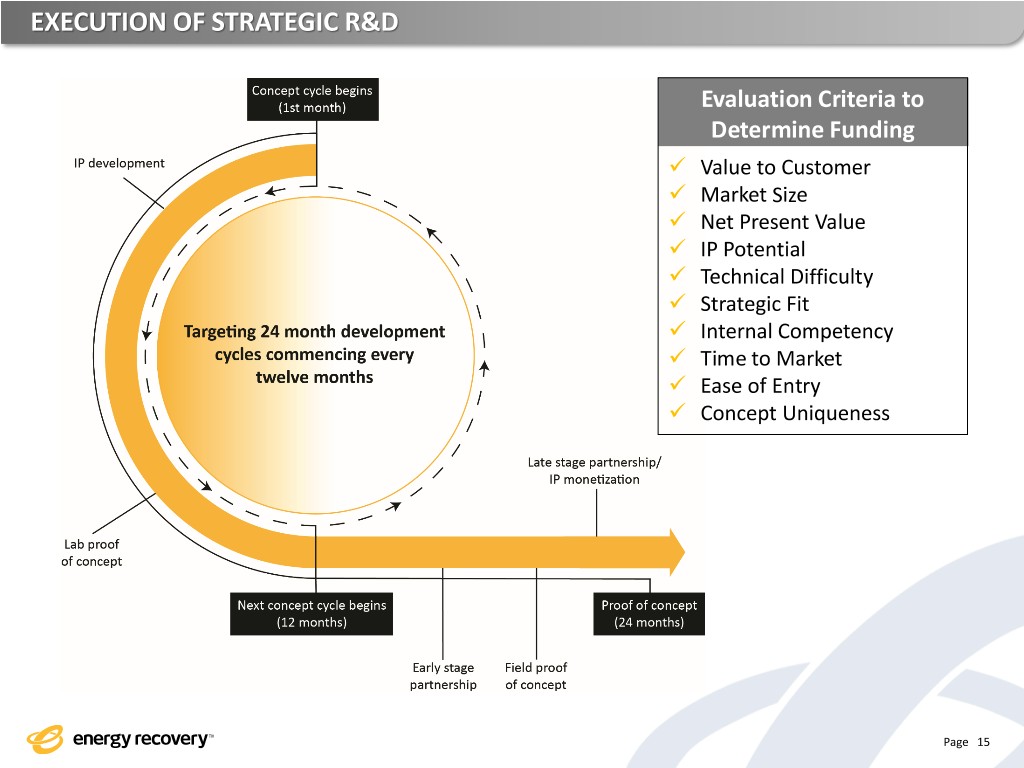
EXECUTION OF STRATEGIC R&D Evaluation Criteria to Determine Funding ✓ Value to Customer ✓ Market Size ✓ Net Present Value ✓ IP Potential ✓ Technical Difficulty ✓ Strategic Fit ✓ Internal Competency ✓ Time to Market ✓ Ease of Entry ✓ Concept Uniqueness Page 15
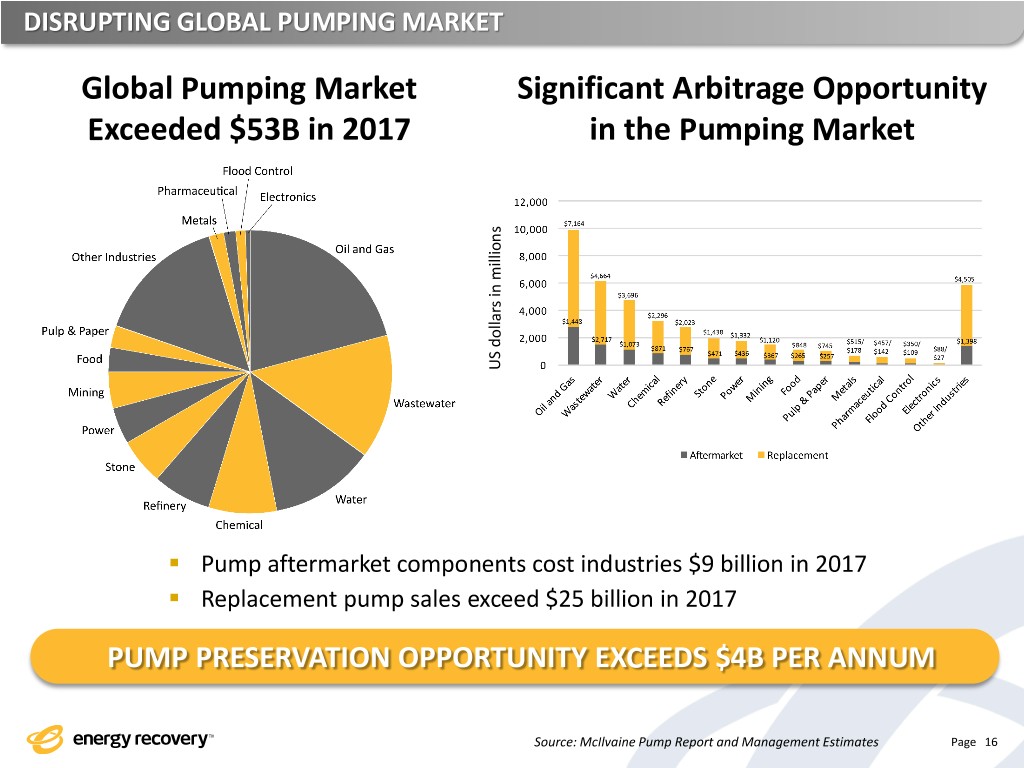
DISRUPTING GLOBAL PUMPING MARKET Global Pumping Market Significant Arbitrage Opportunity Exceeded $53B in 2017 in the Pumping Market US dollars in millionsin US dollars ▪ Pump aftermarket components cost industries $9 billion in 2017 ▪ Replacement pump sales exceed $25 billion in 2017 PUMP PRESERVATION OPPORTUNITY EXCEEDS $4B PER ANNUM Source: McIlvaine Pump Report and Management Estimates Page 16
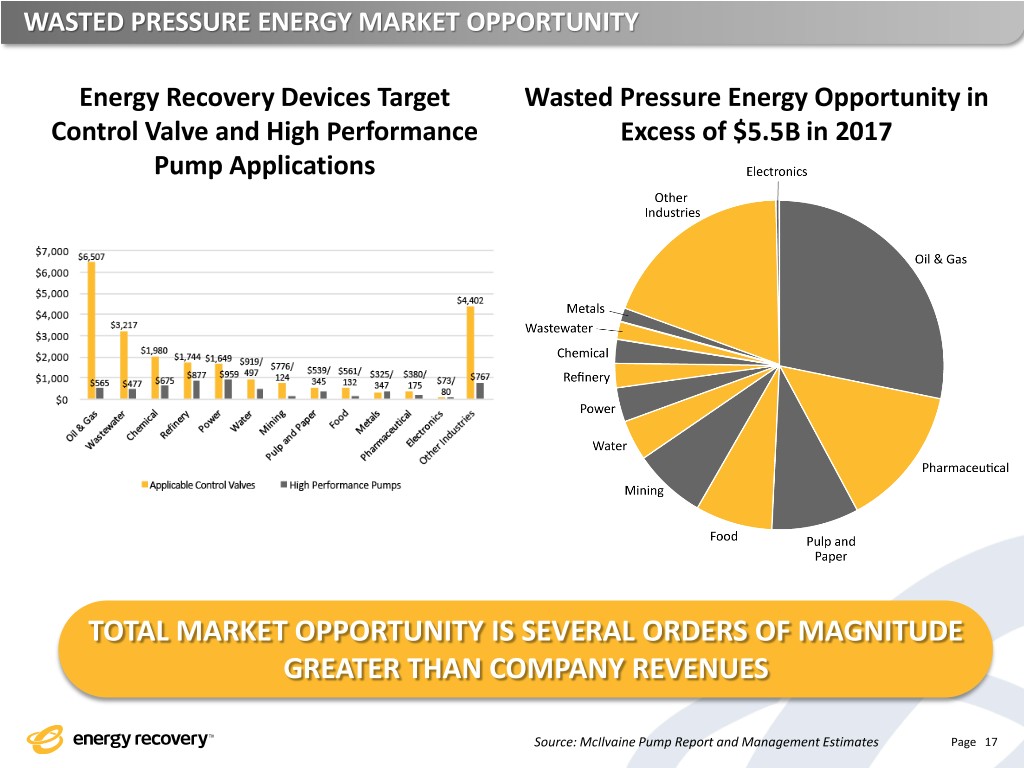
WASTED PRESSURE ENERGY MARKET OPPORTUNITY Energy Recovery Devices Target Wasted Pressure Energy Opportunity in Control Valve and High Performance Excess of $5.5B in 2017 Pump Applications TOTAL MARKET OPPORTUNITY IS SEVERAL ORDERS OF MAGNITUDE GREATER THAN COMPANY REVENUES Source: McIlvaine Pump Report and Management Estimates Page 17
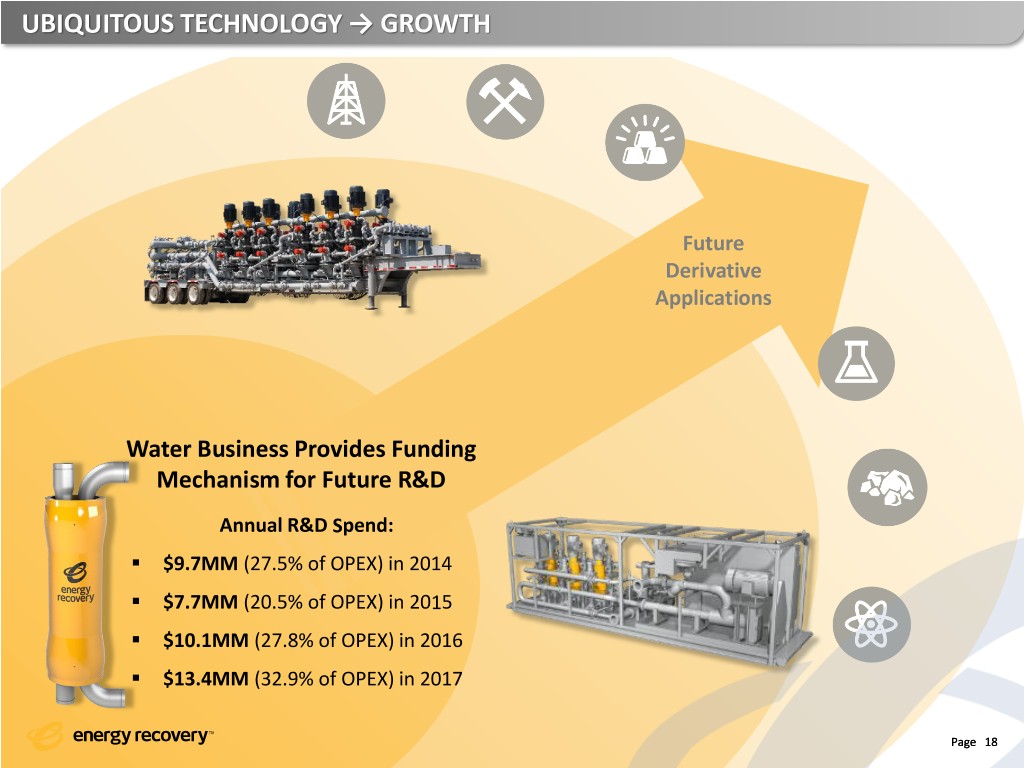
UBIQUITOUS TECHNOLOGY → GROWTH Future Derivative Applications Water Business Provides Funding Mechanism for Future R&D Annual R&D Spend: ▪ $9.7MM (27.5% of OPEX) in 2014 ▪ $7.7MM (20.5% of OPEX) in 2015 ▪ $10.1MM (27.8% of OPEX) in 2016 ▪ $13.4MM (32.9% of OPEX) in 2017 Page 18
THANK YOU